Planetary Aspects and the Correlation with the Timing and Rate of Terrestrial Earthquakes
By
Brian T. Johnston. B.Sc.
Abstract
This paper will demonstrate the association between the timing and rate of earthquakes and the geocentric planetary aspects. The hypothesis is that there are more earthquakes occurring just as the closest angle between the planets of the twenty-fourth harmonic (360/24=15 degrees) is approaching, or as it termed applying, to the exact angle than the period, or separating angle, just after the event has occurred. Not all aspects are able to be correlated with earthquakes as there are tens of aspects for every earthquake greater than 6 on the Richter scale, but rather that when there is sufficient pressure built up in the fault lines to make an earthquake immanent, then it is more likely to happen during the period of applying aspects compared to other times. Previously published research by the author has shown that there is a significant statistical correlation between the timing of earthquakes and the timing of the geocentric aspects of the planets. This research involved tens of thousands of earthquakes and over 6,000 hours of investigative work and observations taking place over the last eighteen years. The preliminary studies undertaken during the 1990’s and early 2000’s strongly indicated that the pattern of earthquakes can be correlated with the timing of planetary aspects between the planets with respect to one another from the vantage point of the earth. What was found in the historical studies was that earthquakes could be correlated with the aspects and that they also tended to occur just before an aspect happens with a large degree of statistical significance. This paper re-examines and elaborates upon these findings and illustrates that the correlations previously uncovered can be shown to be valid over long periods of time.
--------------------------------------------------------------------------------------------------------
Introduction
This is a study of the relationship between the planetary aspects and the rate of quakes that occur over time on the earth. Planetary aspects are precise angles that are formed between the planets as they orbit the sun. From the vantage point of the earth they form these angles due to the relative position between the planets and the position of the planet in its orbit. These angles, or aspects have been claimed by astrologers since time immemorial to be responsible for many natural disasters, including earthquakes.1 Earthquakes were chosen as the events to study as they are all very similar events in nature and repeat on an apparently random basis and a phenomena for which there has never been observed any kind predictable of pattern during which they occur. Astrologers have also claimed that events tend to occur more frequently, but not exclusively, before an aspect occurs. Earthquakes should then tend to occur more frequently just before the timing of the actual aspect and drop off after the aspect happens. There has never been a comprehensive study undertaken to validate, or disprove this claim, although several researchers have started preliminary studies.(1,2,3,4) There have also been highly publicized theories that claimed that grand planetary alignments with most of the planets near conjunction on one side of the sun would create enough tidal force on the earth to produce very large earthquakes, such as The Jupiter Effect.7 This paper will show that there is a correlation the angular relationships between the planets and the timing and rate of earthquakes over time. All the aspects used in this study are geocentric, in other words as observed from the vantage point of the earth. (See Figure 1.)
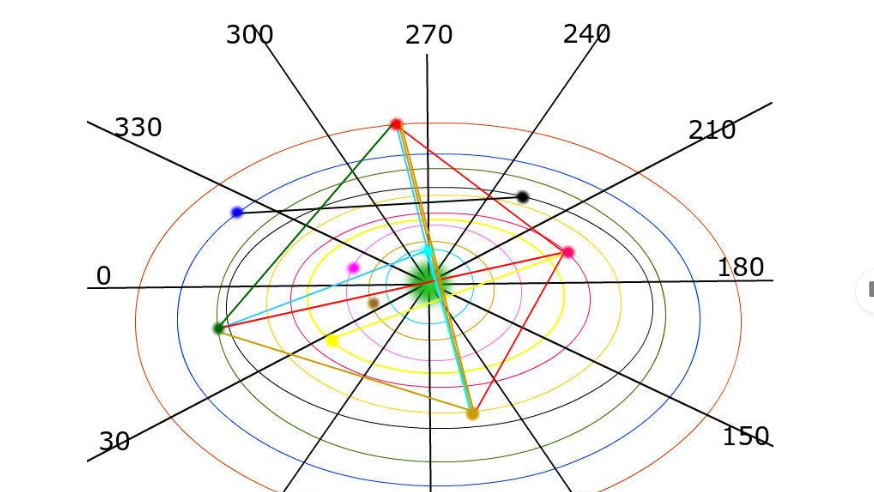
Figure 1. This is a Ptolemaic, geocentric view of the solar system including the outer planets Uranus, Neptune and Pluto, unknown in Ptolemaic times. This map is for the exact time that Jupiter was in opposition (180 degrees) to Pluto on May 20, 2014. The numbers around the outside on the lines are ecliptic longitude. The earth is the green at the centre and then the orbits of the planets are as follows Moon, Mercury, Venus, the Sun, Mars, Jupiter, Saturn, Uranus, Neptune and Pluto. The lines between the planets are the aspects made between the planets and the colour represents the aspecting planet. An inner planet always aspects an outer planet as the inner planet has a greater velocity than an outer planet has. Each aspect noted in the diagram above is less than one degree from the perfect angle. The moon is at 90 degrees to Uranus, 180 degrees to Jupiter and 0 degrees to Pluto. Mercury and Venus make no aspects. The Sun is at 165 degrees to Mars and Mars is at 90 degrees to Jupiter and Pluto and 180 degrees to Uranus. Jupiter is at 180 degrees to Pluto and 90 degrees to Uranus and finally Uranus is at 90 degrees to Pluto. These angles of 0, 90 and 180 degrees made up the asterism known as a Grand Cross.
Preliminary studies of the relationship between the timing of earthquakes and planetary aspects were made and published in The International Astrologer, the Journal of The International Society for Astrological Research8, and by the University Center for Astrological Research (CURA) in Paris, France9, by the author in the late 1990’s and the early 2000’s to examine which, if any factors used by astrologers to determine the nature of events were valid and would able to be correlated with the rate and timing of earthquakes.
No factors used by the astrologers, such as the signs of the zodiac10, the point where the zodiac intersects the eastern horizon, known as the ascendant,11 the point where the ecliptic intersects the horizon on the east. The midheaven12, the point where the zodiac is intersected by the local meridian, or any of the houses, the twelve divisions of space and time around the earth, were found to be statistically significant enough in the timing, or rate of earthquakes to be included in this study. Other factors such as the eastpoint (the point due east where it intersects the horizon,) asteroids, the nodes of the moon13, planetary nodes, and Arabic parts14 were all tested, but none of these factors were found to be significant in the rate, or the timing of earthquakes. All the aspects that astrologers used were tested. They are constructed by dividing the circle into various sub units by various numbers such as seven, nine, ten, and twenty-four. All aspects were tested and the only aspects that seemed to have significance were the aspects created by divided the circle of 360 degrees by 24 to yield 15 degree sectors. This is otherwise known in geometry as the twenty-fourth harmonic. In fact this was the only factor tested of all the elements used by astrologers to have any significance at all in the initial studies. The only aspects that were used for these studies of the 24th harmonic were the ones traditionally used by astrologers, namely zero degrees, 30 degrees, 45 degrees, 60 degrees, 90 degrees, 120 degrees, 135 degrees, 150 degrees, and 180 degrees. Fifteen degrees, 75 degrees, 105 degrees, and 165 degrees are not generally used by astrologers and so were not included in the original tests undertaken in the 1990’s.15 These angles were found to be significant in later studies and are included in the main discussion in this paper.
Since ancient times the planets have been associated with events on the earth, such as earthquakes. Ptolemy in his Tetrabiblos, written in the second century AD states that when Mars is in opposition to Saturn there will be earthquakes (Book IV, Chapter 8. “si sint oppositi secundum longitudinem.”) If the suspected links between the planets positions and events on earth can be shown to have some correlation then the assumptions made by the ancient astrologers and scientists in some degree was correct.
The Mystical Implications of Planetary Influences on History and Religion
We know that Venus and its’ cycles have played a major role in mankind's mystical relationship with the universe since ancient times. (28) This is partly due to the fact that a pentagram is formed in the sky as the conjunctions of Venus and the earth are plotted in the sky. The points of conjunction over an eight-year period form a pattern where the points of conjunction are seventy-two degrees apart. Venus makes 13 orbits in this time period. The period of Venus is fifteen days squared, or 3x5x3x5, from which can be derived the five-day cycle that will be presented later in this paper. When Venus orbits once the Earth is 72 degrees from Venus. The fact that for longer periods, five day cycle of earthquakes still holds true seems to illustrate some profound correlations with planetary cycles in general. The ancient mystics may have noticed a periodicity in events related to Venus, which very likely as it always played a prime role in ancient astrology. Also, the period of the orbit of Venus is the period of the orbit of earth allowing for a small margin of error, divided by 1.618, known as the Golden Mean. The Golden Mean had great mystical significance to the ancient mystics. (29) The actual period is 364 days over the Golden Mean. The period of 364 days is exactly 13 lunar months of 28 days, 52 weeks of seven days, the average of the sidereal month, and the draconic month. The difference between the period of Venus and the Earth is compensated by the orbital harmonic of the Earth and Mercury, which is 29 periods of Mercury equal 7 to periods of the Earth of 365.25 days. This is almost exactly balances the orbital harmonic equation. The period of Mercury is 88 days. Four times 88 is 352 days. This makes almost exactly 13 sidereal periods of the moon of 27.3 days with 2.9 days left over. This is almost exactly one tenth of the moon’s shortest synodic period of 29.18 days. The longest lunar synodic period is 29.93; twice the period of Venus is 450 days, or 15 times 30, so the whole is thus balanced to within 1.68 hours. These harmonic numbers show that the arrangement of the planets in their orbits is highly rigid, with the motions of every body in the system being timed to some extent by the all the other bodies of the system. This would have appeared to a profound truth to the ancient mystics which is made even more mysterious by the fact that the periods are heliocentric and not geocentric. It has always been supposed that the ancient peoples always presumed that the sun sent around the earth and not the other way around.
The positions of the orbit of Venus when it makes a conjunction with the earth forms a pentagram over eight years, but it is a heliocentric phenomenon, so for the ancient mystics to associate the pentagram with Venus they must have been aware of the heliocentric nature of the solar system.(30) Sometime in the third century BCE Aristarchus proposed that the earth and planets orbited the sun and that the stars were themselves suns seen at a very great distance. As result many of the Ancients were aware of the idea of a heliocentric universe and would have been able to roughly calculate the positions of Venus and the Earth in a heliocentric geometry. This would have been akin to sacred and secret knowledge.
When the pentagram is formed in the sky, it is not perfect and in fact precesses by 2 1/4 degrees every eight years. It takes 160 years for the complete rotation. However, there is a perfect alignment between the two orbits every 45 years, or 3x15 years, as 45/2.25=20. The precession moves by 101.25 degrees in 45 years and four times this period is exactly 405 years. If we divide 405 by 15, we get 27, 9x3. The orbital precession of 160 years divided by 24 equals, 6.6667 years, which is a term of the Golden Ratio, as explained by Meyer. (31) If 6.6667 years is multiplied by three it equals 20 years almost to the second. If we take the period of the precession of the pentagram, it is comprised of 20, eight year periods, or pentagrams. The pentagram is five sided; three times five is fifteen, the base number of the 24th harmonic, and three times the number of days in the earthquake sine wave. Of course, from peak to valley and back across the next peak again is 15 days. We also know that the conjunctions of Jupiter and Saturn occur every 20 years. To make the complete cycle where the conjunctions of Venus and the Earth complete a full synodic cycle is 243 years; the time it takes for the transit of Venus to occur on the same day. This is exactly 3 times 81 years, the period of Uranus around the sun. The 160 year cycle has to be repeated 9 times to make 1,440 years when the transits take place across the same place on the sun and same day of the year. All of these cycles can be seen to have the root value of five days as observed in the periodicity of large earthquakes during the study period. This is all part of the physics of orbital harmonics and yet suggests a mystically significant series of coincidences.
If the ancients knew that the solar system was heliocentric, as the pentagram associated with Venus would seem to suggest, then this may go a long way in explaining some of the symbolism of the New Testament. In the New Testament, we see Jesus, the Son of God, surrounded by twelve disciples. This is similar to the Sun displaced to the center of the solar system and the twelve zodiacal signs. The Egyptian Pharaoh Akhenaten's heliocentric religion was based upon the idea of single god, whose physical manifestation was the sun's bright disk: The Aten (☉.) The ☉symbol is in the geocentric model, the orbit of the sun around the earth, but could equally be interpreted as the earth orbiting around the sun. In some respects, Akhenaten’s thought that the Aten was not the disk itself, but was the deity behind the sun's disk, which was the true god. Akhenaten was considered to be a heretic for removing the former gods of the Egyptians from the temples and to formulate a religion of a single god, the Aten. It may have been the early discovery of a heliocentric universe that motivated him to change the religion, and this may be the “secret” teaching of many ages. There is also good evidence that the heliocentric nature of the solar system was even known to Imhotep, the architect of the first pyramid at Seqqara, as there are five pointed stars bas reliefs on the walls representing Venus. By implication this indicates its five to eight year ratio of orbital harmonics with the earth and the hidden pentagram in the sky. This is codified in Matthew 16:18 (1.618 is the Golden Mean of geometry) where Jesus says Peter is the rock upon which he will build. The rock being the “Holy Grail” and Peter is an allusion to a rock in Latin, or Petra.
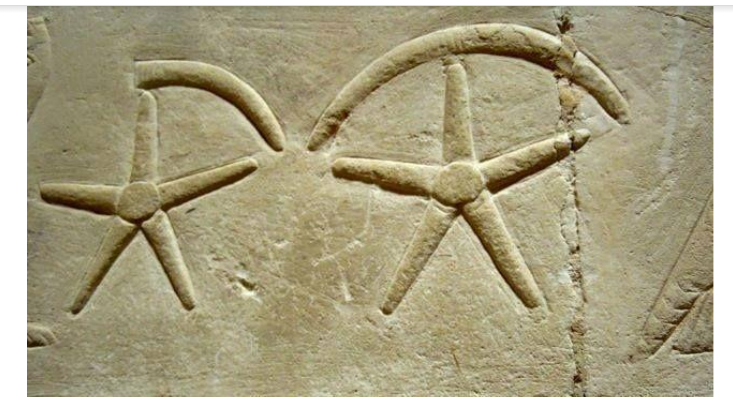
Figure2.
Five pointed stars from the walls of Saqqara representing Venus. It is also intriguing to note the crescent shape above the stars as Venus goes through phases and appears through a telescope as a thin crescent when it is at its brightest. It would appear from this that the earliest Egyptian Dynasties knew that the earth went around the sun and that the pentagram was the secret symbol for this knowledge. (Image courtesy of the author.)
Observations and Analysis of the Apparent Association between Applying Planetary Aspects and Earthquakes
Methodology
The methodology used to collect and analyze the data was to record the timing of earthquakes and then to determine what the positions of the planets were at the same moment as when the earthquakes occurred. Then the positions were studied to see if the aspect that was nearest to being a perfect angle, such as exactly 120 degrees, was applying, or separating. This was taken as the primary trigger aspect as at any given time there are several different aspects occurring in the range of plus, or minus one degree from the perfect angle. An aspect is created when an inner planet, that is a planet with an orbit of smaller diameter, makes a perfect angle with an outer planet, being a planet with a larger orbital radius. Retrogradation, or the apparent reverse apparent motion, of the planets was also taken into account and as the planet approaches the perfect angle with another planet even when it is retrograde in motion is also considered to be an applying aspect. The fact that from random samples it can be seen that the probability of any aspect at any random time may be applying, or separating is a 50/50 split. The results can then be analyzed by a simple coin toss analysis where the number of tails, in this instance separating aspects, is subtracted from the number of heads, applying aspects and then using this as the to which the number two is raised. The probability of a coin landing heads, or tails is 50/50, the same as the probability of finding an applying, or separating aspect between the planets. As an example take a penny and double it every time there is a positive result and divide it by two when there is a negative result over a period of time if the results are more in favour of the positive results a great deal of money will be accumulated as a result. The follows the formula Xy-x. For example toss a coin twenty times and it lands on heads 18 time and only two tails then the probability that this will occur by random chance is 2 to the 18th power, or 65,536 to one odds against chance for this to occur randomly. The formula is P=2X-2Y, where Y is heads and X is tails, or this case applying aspects and Y is separating aspects. The probability of the pattern of a series of events occurring is the multiplication of the probability of each event multiplied by the probability of each event in the series. This is the equivalent formula. To calculate the probability of independent events simply multiply each probability together. In the case of getting an even number on a series of spins on a wheel numbered from one to three we get:
2/3 x 1/3 x 1/3 x 1/3= (2/3)(1/3)3=2/81
If we have a probability of 0.5 then over 94 events 64 are even and 30 are odd then we have:
230x1/264=17,179,869,184.
The same data is also analyzed through binomial distribution, which affords similar, but lower probabilities.
To find the significance of the data for the periodicity of earthquakes and if it follows any stable patterns, such as the five-day wave discussed later in the paper, Pearson correlations were used. Pearson Correlations are used to determine if two sets of data are in agreement in so far as whether the high and low peaks are in similar or the same time frames as the data being analyzed. In other words do the peaks and valleys of the curves from the two sets of data agree? Any correlation above 0.50 is considered to be significant with the significance increasing as the correlation between the two set of data approaches one, which is a perfect correlation.
Poisson distributions are also employed to illustrate the distribution of the events for each aspects deviation from an angle of the 24th harmonic from the exact aspect. For the main study from the 18th of February to the first of May there is also generated a random theoretical data set for the same number of events and this is plotted as well. A t-test was undertaken between the two sets of data and the probability of the null hypothesis is calculated.
For the more recent studies all data was collected exactly as it was displayed as a result of the search engine of the USGS website (http://earthquake.usgs.gov/earthquakes/search/database) with no sorting of data in any way. Only earthquakes greater than 6.0 were used. No earthquakes greater than 6.0 on the Richter Scale were omitted. The database for the earthquakes was derived via the search feature on the USGS website.16 No filters were used to clean the data and only the raw data provided by the website was used with no alterations. All earthquakes greater than 2.5 on the Richter scale for the historical studies that were undertaken in the 1990’s were used as the criteria for quake selection. Each number on the Richter scale is 50 times greater in magnitude than the previous number. This means that the earthquake used for the more recent studies were much more powerful on average than the historical study. From this we then have a very good range of earthquake magnitudes from which to make our observations
During the initial studies, which took place in the 1990’s, data was randomly gathered to analyze to see if any astrological factors could be correlated with earthquakes. This finally resulted in database of 1453 earthquakes for which horoscopes were erected to the exact second of time and to the minute of longitude and latitude for the locations of the earthquake events. In this instance a horoscope is a map of the sky plotting the exact positions of the planets in ecliptic longitude. The computer program Solar Fire was used for these calculations which and is accurate for the positions of the planets to the nearest arc second and for the moon to less than 10 arc seconds. The aspects were calculated the nearest arc minute. The first and main test of the hypothesis was to see whether, or not the earthquakes would occur more frequently just before, or just after an aspect occurred. The results were compared with random times for periods when there were no earthquakes and an equal number of random times were analyzed. This study confirmed that the probability for a random time having the closest aspect to a perfect angle being applying, or separating was equal with 50% chance for each, so completely random.
The main event that this paper focusses upon is the Grand Cross of Planets, which involved the Moon, Mars, Jupiter, Saturn, Uranus and Pluto. During this event all of these planets were at 0, 90, or 180 degrees to one another forming an apparent cross in the sky. This was considered to have peaked when the giant planet Jupiter was at 90 degrees, or square to Uranus and in opposition to Pluto on the 19th and 20th of April, 2014. The main study period for this paper was over the preceding weeks and months as the planets were in approaching this configuration and the over the following six weeks after the 20th of April until May 1st, 2014.
Discussion
The premise is that if no astrological factors have any effect that is detectable on any physical system on the earth such as earthquakes, then there can be no astrological effects and the ancient astrologers may have been wrong in their assertion that there were astrological effects. The purpose of this paper is to show that there are planetary influences that can be measured and studied and indeed the planets do affect life on earth in both subtle and profound ways. Also discussed is the idea that this knowledge was also available, if verified, to the ancients astronomers and thus has influenced the development of mysticism and religion in all eras of history.
To summarize the previously published studies, (17) what was found was that with the final database of 1453 earthquakes greater than 2.5 on the Richter scale, 61.5% of the earthquakes occurred when the planetary aspect that was closest to the exact angle of the aspect was applying, in other words before the planet was at the actual perfect angle of the aspect, and 38.5% of the quakes occurred during separating aspects. It was also found with a study involving 1,975 earthquakes that the frequency of all earthquakes greater than 2.5 on the Richter scale increased in the three days leading up to the time of the aspect and peaked in the day before the actual astronomical event took place. (See Figure 2.) These observations demonstrated an increase in the rate of earthquakes in the three days leading up to quakes, which peak on the day before the actual aspect occurs, and then drops back to baseline within two days after the aspect occurs, about five-days for the cycle to transpire. This is relevant due to the fact that the aspects of the 24th harmonic are 15 degrees each and when 360 is divided by 45, which is 3 times 15, then the result is five, that will be shown to be relevant later in this paper.
Historic Observations of Seismic activity and Astronomical Observations
The first figure shows the number of earthquakes greater than 2.5 on the Richter scale for the days before and after the five aspects that were selected for this study in 1999. The aspects were chosen as they were the only aspects during the entire fall of 1999 to not have any other concurrent aspects during the periods when each of them were in effect for any planet outside the orbit of the earth. The reason for this was so that the effects of the aspects could be isolated from the possible effects of other planetary aspects. The aspects that met the prescribed criteria were Jupiter square (90 degrees) Neptune on October 10th, 1999, Saturn square Uranus on November 14, 1999, Mars at 120 degrees to Saturn on November 4, 1999, Mars at 60 degrees to Uranus, September 22, 1999 and Mars at 120 degrees to Jupiter on October 17, 1999 . It is quite rare to find these ”naked” aspects as at most times there are several aspects within one degree of a perfect angle at any given time.
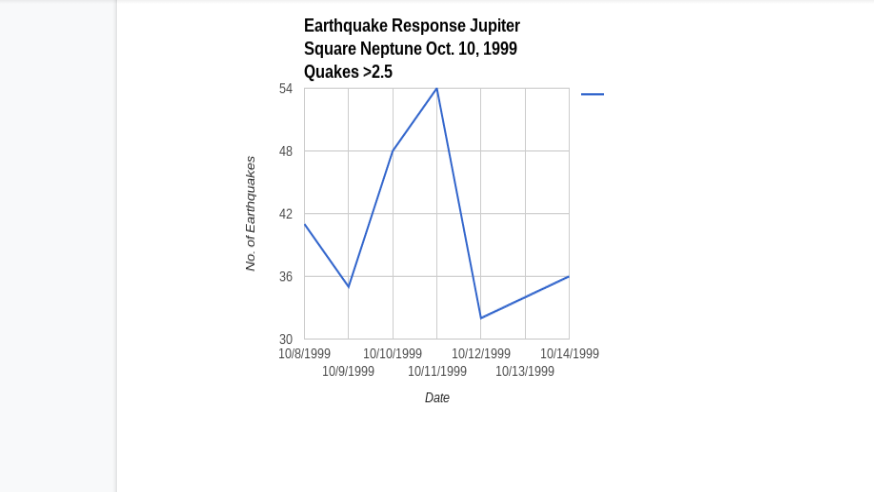
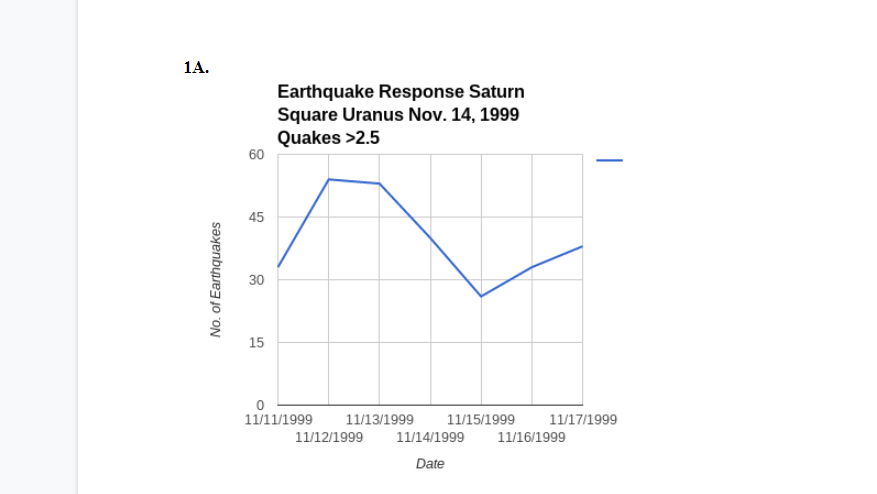
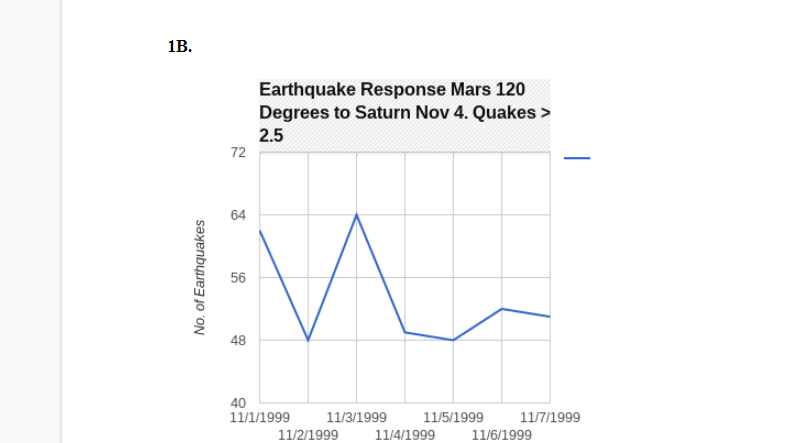
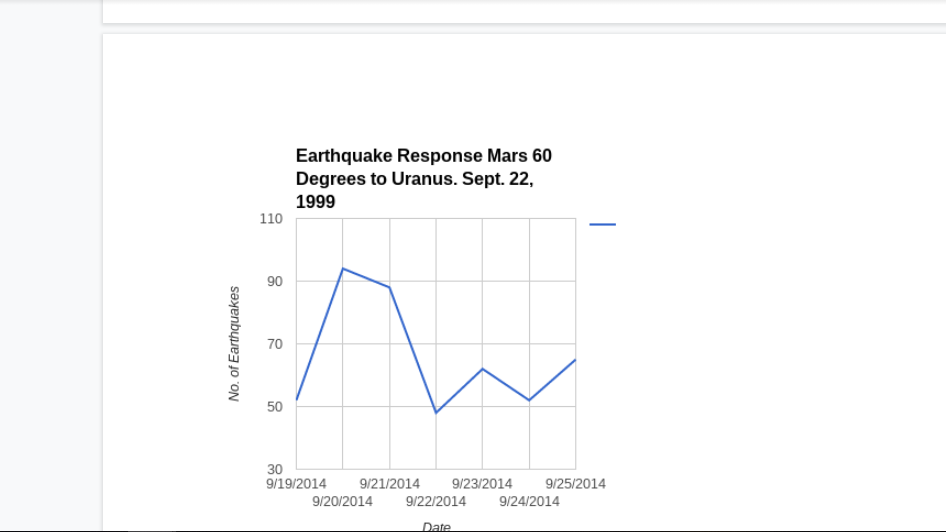
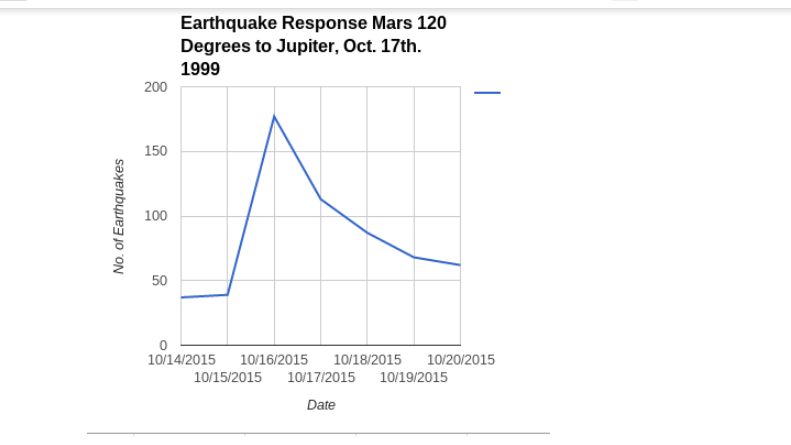
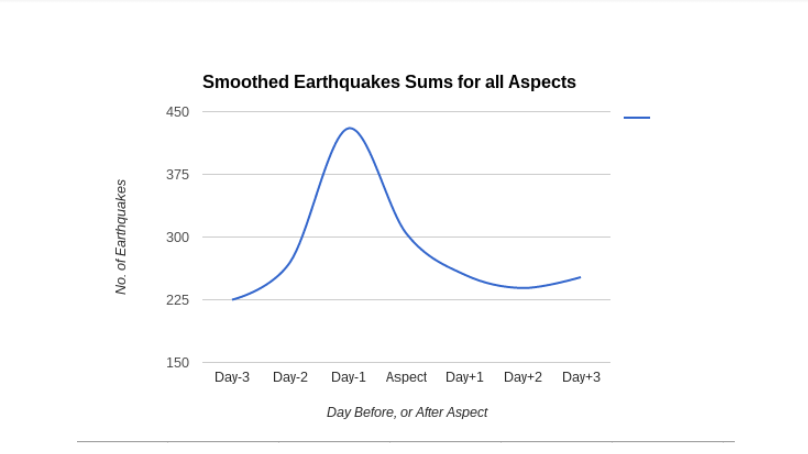
Figure 3.: A Number of aspects between the outer planets was studied (1A-1E,) as seen in the graphs above for earthquakes greater than 2.5, and the number of quakes per day for the day of the aspect and for 3 days before and 2 days after the aspect were tallied for all the aspects and the resulting curve is noted above This final graph illustrates beautifully the geo-seismic response to the planetary aspects as a whole. For this graph all of the earthquakes that occurred on each of the respective days prior to, during and after each aspect were added together and the result were graphed. On aspect day –3 the sum of the number of events is 247. On day –2 the number of earthquakes rises to 309. Day –1 continued the increase to 454 earthquakes. This number starts to decline on the aspect day to 345. Aspect day +1 continues this decline with a sum of 267 events, which continues with only 255 events on day +2. The last day under study has a sum of 270 events. This clearly shows there appears to be a correlation that exists between the timing of the aspects and the timing of earthquakes. It also indicates that the peak actually occurs slightly before the time of the aspect. There are almost twice as many earthquakes Day-1 as on Days -3, +1 and +2, in other words on average there are twice as many earthquakes on the day before a major aspect when compared to other days. It is also the rarity of these events to consider. Saturn square Uranus only occurs once every 40 years, Jupiter square Neptune every 14 years and the Mars aspects only once every three years. These particular aspects were chosen both due to their rarity and due to the fact that no other planetary aspects were occurring during the time periods in question to contaminate the results. For all of the aspects studied the rate of earthquakes either peaked on the day of, or on the day of the aspect.
The Grand Cross of Planets 2014
From the above studies, it was shown that there appeared to be a link between the orbital positions of the planets and natural physical phenomena, in the form of earthquakes, on the earth.18 It was necessary to undertake an additional study to see if timing of aspects could be confirmed to be associated significantly with a peak in the number of earthquakes in the period just before an aspect forms as indicated in the historical studies. In an attempt to replicate these earlier studies a detailed series of observations which were made of the rare geometrical configuration, known as a Grand Cross by astrologers, between the planets Mars, Jupiter, Uranus and Pluto. The main event was to occur on April 20th when Jupiter made an exact square of 90 degrees to Uranus and was in opposition to Pluto at 180 degrees. Observations started on February 18th, 2014 and were continued until May 1st, 2014. Only earthquakes greater than 6.0 were observed as the astrologers were anticipating there to major physical events to happen during this period. (18, 19, 21)
During the period of the observations there were 46 earthquakes greater than 6.0 on the Richter scale. Over the previous year there were 158 earthquakes of this magnitude,22 this already indicates a possible anomaly as this period of 71 days is 19.5% of a year and there would be then expected there to be about 31 earthquakes, or about 50% more earthquakes expected for this timespan than were actually observed. Of the 46 quakes, 34 occurred just before an aspect occurred and only 12 occurred just after an aspect occurred. As there is a fifty percent chance for an earthquake to occur before and aspect and the same afterwards, then the odds against chance for this are 222 odds against chance that the planetary aspects are not associated with the earthquakes timings, or 4,194,304 to one.23 Well beyond the 5 sigma required by the Astrophysical Union for a true observation.24 The binomial distribution is p=0.00055. If we take what the actual deviation from the true aspect that the closest aspects angle was and analyze the distribution when compared to a randomly generated database calculated from the expected model this is too found to be significant at the 99% confidence level. The T-value is 2.685741. The P-Value is 0.008617. The result is significant at p < 0.01. (See Figures 3 and 4.)
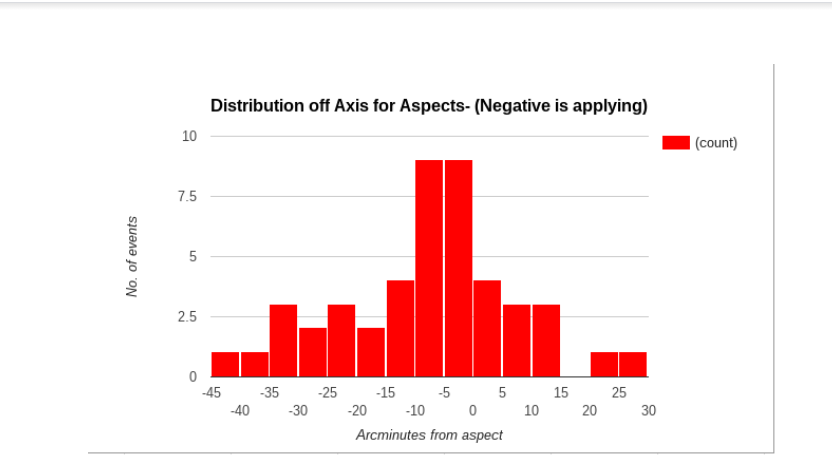
Figure 4. This graph shows distribution of the deviation for the arc between the actual separations of the planets and the perfect geometrical angle of the various aspects of the 4th. Harmonic over the 71 days of the study period from February 18th. to May 1st, 2014. (Values in arcminutes.)
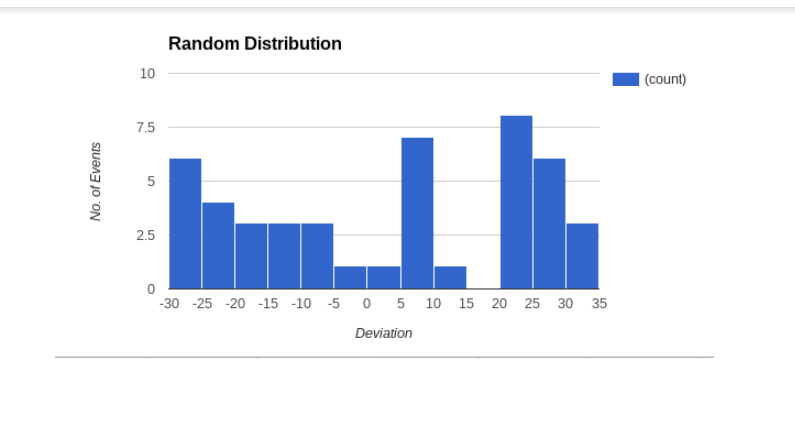
Figure 5. Random distribution based upon theoretical values for the same number of events as the study period.
Further observations for the number of earthquakes of earthquakes of this magnitude to occur between September, 2013 and May 5, 2014 were carried out and graphed. This observational time span was then divided into five-day segments and the number of earthquakes to occur for every five-day period was tallied. It was found that the period preceding the April 20th period was the highest peak on the graph with nine earthquakes occurring between the 8th and the 13th and five more from the 14th to the 18th of magnitude 6.0 or greater on the Richter Scale.
It was also discovered that by dividing the period into five-day segments a sign sine wave of earthquake frequency appeared. In the Study period there was definite sine wave where during one five-day period there would be a maxima of earthquakes and in the next period there was a minima of quakes. (See Figure 5.) When the entire span from September 2013 to May 2014 was examined it was noted that this sine wave was evident during the entire study period. It would go periodically through a polarity change where there would be two five-day periods at an elevated level, and then it would return to the sine wave periodicity. Other periods were examined such as three days and seven days, but there was no indication of any periodicity in these cycles. Only the five-day period exhibited the sine wave phenomena. The changes in polarity were found to be associated with the orbit of the earth and Venus and were associated with the aspects between them. When the earth and Venus make an aspect this tends to repeat the maxima of earthquakes for ten-days and then the rate of quakes returns to minima.
A complete analysis of the earthquakes from January 8th to May 29th, 2014, somewhat surprisingly illustrates that the second highest peak of seven quakes during the period between the 12th to the 17th of May, which was after the aspects of the grand cross occurred. During this period, however, the inner planets, Mercury and Venus, made aspects with Neptune, Uranus and Pluto. On the 12th, the sun was at 75 degrees to Neptune and there was a 6.5 near the SE Pacific Rise. On the 14th, Venus was 90 degrees from Pluto and Mercury was 150 degrees to Pluto as well, and there was a 6.5 in Panama and a 6.1 in Micronesia. On the 15th, Mercury was 60 degrees from Uranus and Venus in conjunction to Uranus as well and there was a 6.6 in the Philippines and a 6.0 in Guadalupe. These aspects appear to have had the action of re-energizing the seismic activity observed during the grand cross in this subsequent period. After the 18th of May the number of large earthquakes returns to zero for the next ten-days. On the 17th Mercury was at 60 to Venus and 30 degrees to Jupiter and on the 18th Venus was at 90 degrees to Jupiter and they made no further aspects with the outer planets involved with the Grand Cross for quite some time. Taken together this appears to be that the aspects of the planets are strongly associated with the occurrence of large earthquakes. (See Figures 6 and 7.) Please note the graphs are for Eastern Standard Time and as a result there were only earthquakes as the peak in the period from April 8 to 13th, 1999. When the results were gathered in UTC, there were nine earthquakes for this period.)
An Apparent Five-day Periodicity in the Rate of Large Earthquakes
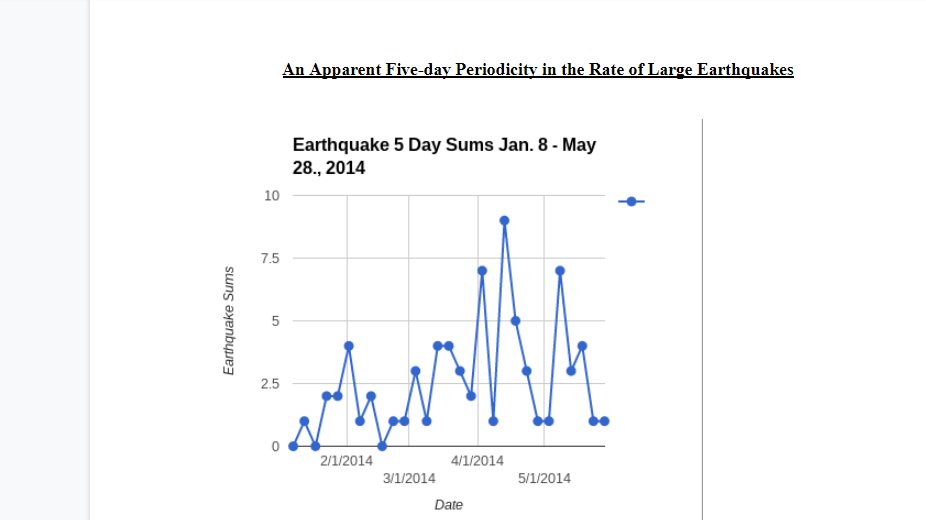
Figure 6. For the period leading up to April 20th, 2014 there was a periodicity where for five-days the number of large earthquakes was high, and during the following five-day period the number of quakes was low. The highest peak of 8 occurred during the time frame of the Grand Cross between Pluto, Uranus, Jupiter and Mars, or April 8th-13th, while the second highest peak of 7 was during the period when the inner planets made aspects to Neptune, Uranus and Pluto from May 12th to the 17th.
Another notable feature of this time period was the 8.2 quake that occurred off the coast of Chile near Iquique on April 1st was the 13th. largest earthquake ever recorded.25 This was the day that the sun was conjunct to Uranus, one of planets involved with Grand Cross that was to occur on the 20th of April. The sun was only 17 arcminutes from the exact conjunction with Uranus and applying. This was very large quake with an energy equivalent to 15 megatons of TNT. (14) Another possibly significant observation is that in December 2013 there were very few earthquakes and there were also very few aspects of the outer planets. The exception was the 120 degree, or trine aspect, between Jupiter and Saturn.
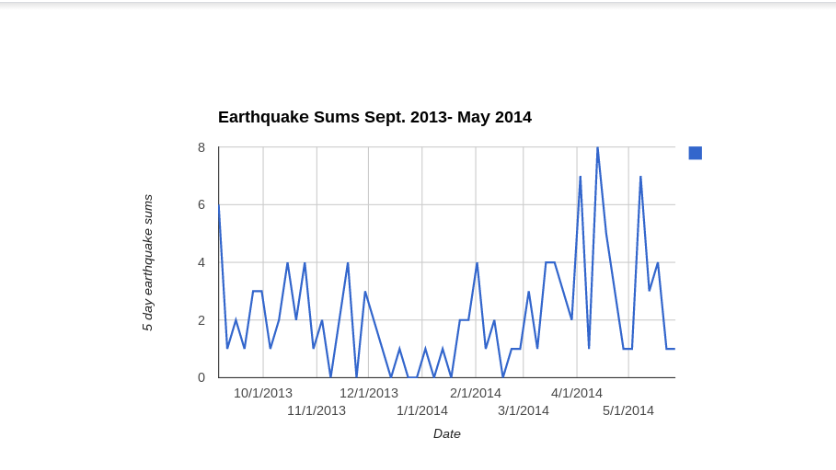
Figure 7. The periodicity of 5 days in the frequency of large earthquakes can be shown to be a standard phenomenon of the timing of earthquakes as seen in this graph of large earthquakes between September 2013 and May 2014 where the numbers of large earthquakes greater than 6.0 are grouped into five-day periods. It can also be seen that the period preceding April 20th, when the 90 degree angle between Jupiter and Uranus and 180 degrees to Pluto took place is the highest point on the graph for the whole period. The lowest period on the graph represents December 2013 when there were few outer planetary aspects.
Additional studies were subsequently undertaken to attempt to determine if the five-day sinusoidal pattern in the rate of earthquakes would hold for longer periods of time. As was mentioned, if the rate of earthquakes is subdivided into various periods of days the shorter periods of less than five-days reduce the data into units that are too small to show any distribution pattern and longer periods have a similar effect in that the data does not appear to show any obvious pattern in its distribution. The pattern appears to be very consistent over long periods of time, but it also appears to undergo phase shifts where the rate may remain high or low for more than one period of five-days and then it resumes the initial 5 day pattern once more, possibly due to interactions between the Earth and Venus. (See Table 3.) The graph below charts the period from August 2013 to November 2014 and clearly demonstrates that the five-day pattern is very apparent. The wavelength of the sine wave from peak to peak is then 10 days. (See figures 8 to 13, also Table 2)
Figure 8. Sums of earthquakes between August, 2013 and November 2014. This graph shows the sums of the number of earthquakes for every five-day period during this time span.
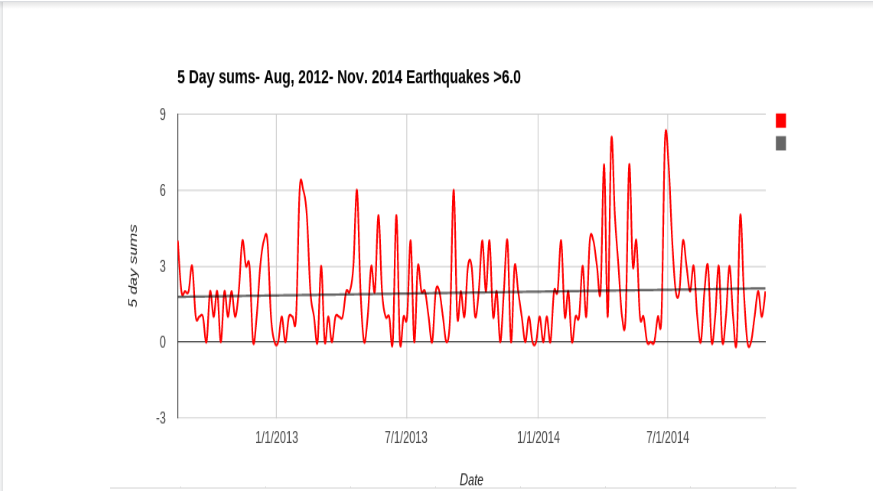
Figure 9. Five-day sums for the period from August, 2012 to November, 2014, EST. The high peak in May 2014 is during the period of the Grand Cross of Planets and the other high peak is in June when the sun and the inner planets made aspects to Pluto, Uranus, Mars and then Jupiter, the planets involved in the Grand Cross. It is apparent that the five-day periodicity to the large earthquake frequency remains even over this period of time. The trend line shows that the actual rate of large earthquakes is very regular and steady. By examining a longer period it becomes more evident what stimulates the polarity changes in the sine wave. This seems to be associated with periods where there an excess of aspects in a short time, or a lack of them. The highest peak during this timespan was from February 4th to the 8th, 2013. During the period from the 3rd of February to the 13th, 2013 there were 21 planetary aspects. From January 9th to March 5th there were 84 planetary aspects. The average number of aspects for the ten-day periods bracketing the February 3-13 time frame was 15.75. The period then for this period was 33% above the average.
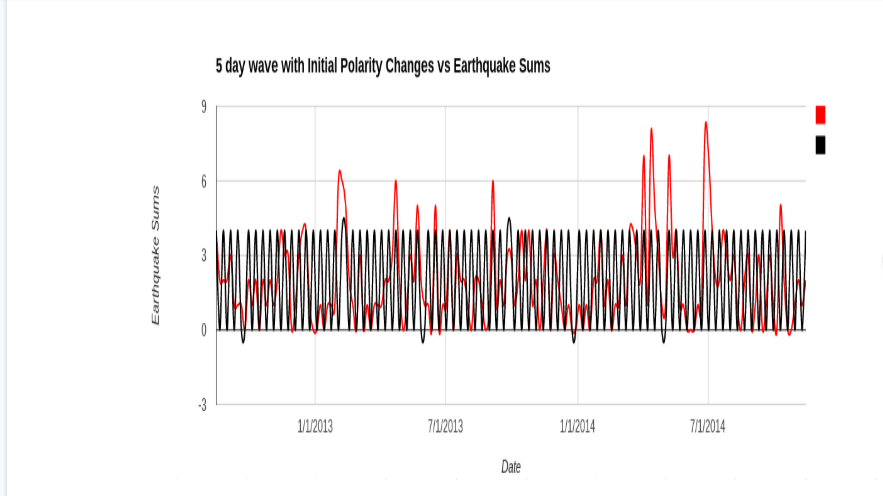
Figure 10. This illustrates the polarity changes where there is an extended maxima, or minima where the polarity of the sine wave reverses, but continues the same 5 day beat pattern. The black line is the plot of a standard 5 day periodic wave with the polarity changes incorporated. The resulting five-day pattern matches the pattern of the earthquake sums very well. The period for each of these extended graphs is from August 8th, 2012 to November 18th, 2014.
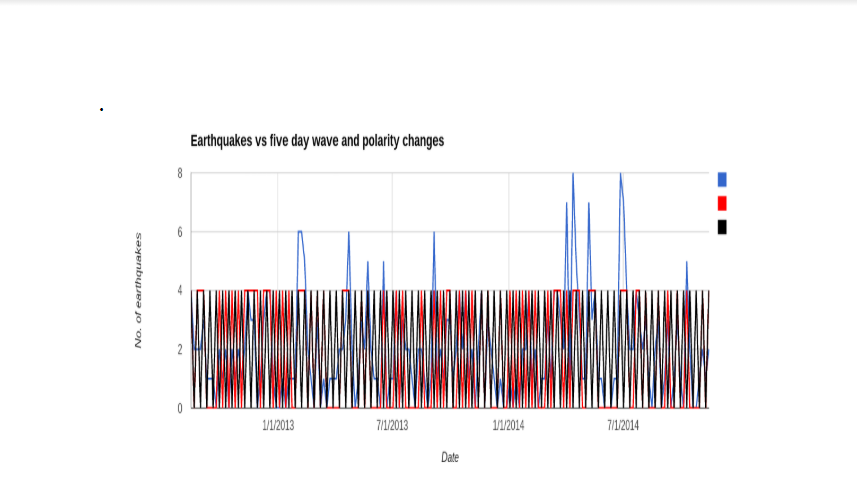
Figure 11. Here illustrated is the regular five-day sine wave overlaid without polarity changes, in black, on the polarized sine wave, in red, from Figure 9. The red areas indicate where the polarity of the curves is opposite. What is significant here is that the pattern does not just drift across the five-day wave like a stopped clock’s time will drift across a plot of the actual time, but rather exhibits discrete polarity changes abruptly and then changes back to the same polarity with equal abruptness. Instead of displaying the expected stopped clock pattern what appears is an irregular beat pattern, sort of like a person with an irregular heartbeat. The polarity at the start of the observation period is the same polarity as at the end of the period. The blue is the earthquake sums for each day period. What this illustrates is that for the majority of the time the five-day wave correlates with the actual frequencies of the earthquakes, but that it undergoes erratic polarity changes and then turns to the previous polarity.
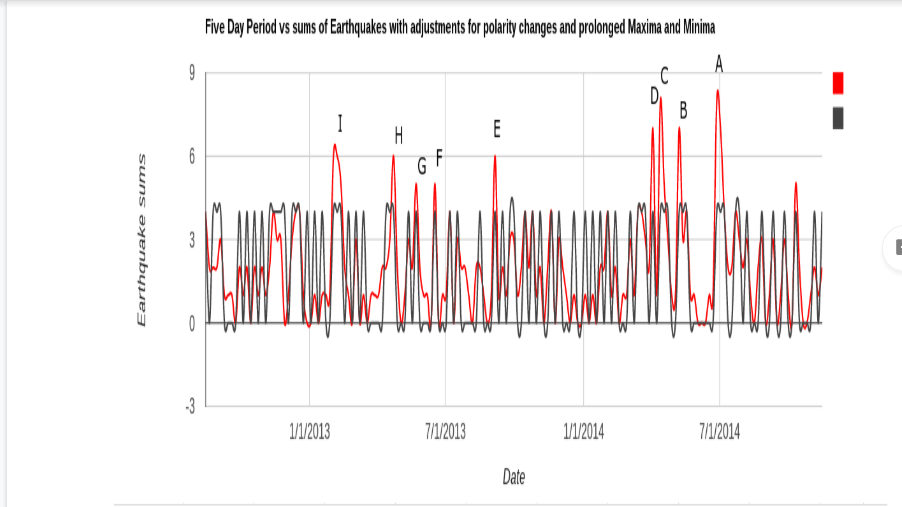
Figure 12. The black line represents the adjustments to the sine wave taking into account every extended maxima and minima observed the earthquake sums periodicity as well as the changes in polarity already noted. The red is the actual earthquake sums for each five-day period. The five-day periodicity is interrupted and then then continues in the opposite polarity and then reverses at the next extended maxima, or minima. A Pearson correlation gives the results r=0.685 with p<0.00001. Table one details the planetary aspects that occurred during each of the lettered peaks in earthquake activity (See Appendix, Table 1.)
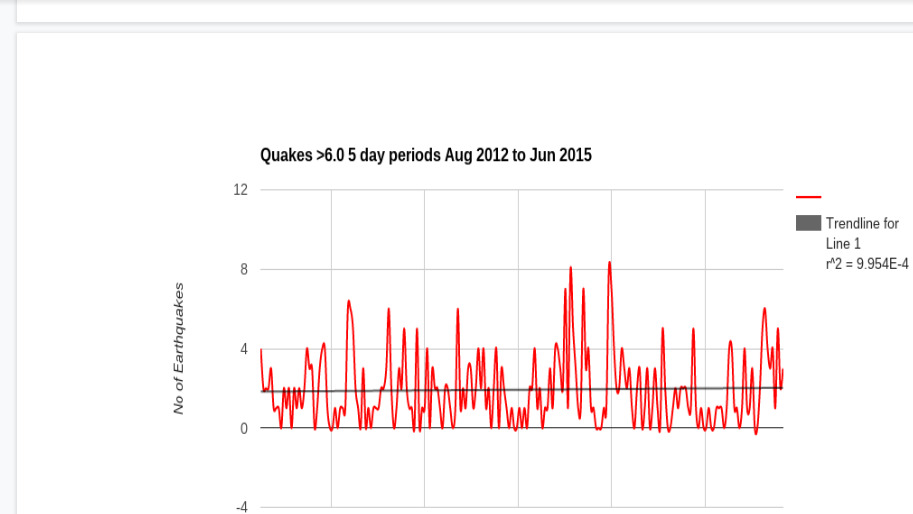
Figure 13. This graph illustrates that the five periodicity of the earthquake frequencies has remained stable to the present day with very little deviation in the trend line as reflected in the extremely small r^2 value. What this also clearly shows is that the trend is completely flat, but in Figure 11 the trend line is ascending over time. The increase in the previous figure was the result of the increase in the number of earthquakes that occurred during the period of the Grand Cross of Planets. In the succeeding year the curve has normalized and the reduction in the overall number of earthquakes is reflected in this.
Is Gravity the Cause of the Apparent Relationship Between the Timing of the Earthquakes and the Planetary Aspects?
By observing the spin rate of the earth we can see whether the gravitational effect of the planets as expressed as a deviation in the spin rate of the earth has an effect on the rate of earthquakes observed during the Grand Cross study period. What can be seen is that the spin rate of the earth decreased around March 16th, the 29th of March, the 15th of April and the 24th of April. During the main study period there were several key aspects between Venus and other planets and this did seem to correlate with the greatest changes in the earth's spin rate. On April 24th as the spin rate of the earth was reaching minima for the period and the spin rate decreased, Venus was at 120 degrees to Saturn. On April 14th Venus was 45 degrees to the Sun and again the spin rate decreased. On April 1st Venus was at 135 degrees to Jupiter and at 45 degrees to Pluto and once again it can be seen that the spin rate was rapidly declining during this period. On the 16th of March, Venus was at 150 degrees to Jupiter and then the next day was at 60 degrees to Uranus. Once an again this was period where the earth's spin rate declined.
While any association between changes in the spin rate and earthquakes is as of yet anecdotal it is highly suggestive that there is an association between planetary aspects and changes in the spin rate of the earth. The previous studies do show an association between earthquakes, however. The standard model of gravitation would not predict any changes in the spin rate of the earth with most of the planetary aspects. The only aspects that could possibly perturb the earth’s spin rate would be 0 degrees, the new moon, 90 degrees, the half-moon, and 180 degrees, the full moon, which are also aspects of the 24th harmonic. These points represent the points of maximum gravitational force change on the earth as a result of the relative vectors of the sun and the moon. (See Figure 14.) The period around April 20th shows an increase in the spin rate of the earth. On May 4th the spin rate of the earth was at its greatest and on this day the Sun was at 60 degrees to Jupiter. This was associated with 4 earthquakes greater than 6.0 during that period. There was a 6.6 in Fiji, followed by a 6.0 near the same place. Then there was a 6.0 in Japan and finally on the morning of the fifth, there was a 6.0 in Thailand. This is a strong association with the aspect of the Sun and Jupiter and is an indicator that the 60-degree aspect between the Sun and Jupiter was responsible for the increase the earth’s spin rate. The angles of the aspects, except as noted above, are not theorized to have any apparent effect on the spin rate of the earth and there is no logical reason to assume that the changes in its spin rate are due to gravitation. However, there may be an argument to support an electromagnetic cause for the change in the spin rate as will be discussed in the next section.
One possible indication that gravity plays a role in the changes of the earth's spin rate is that the two highest peaks on the graph, or slowest spin rate, March 30th and April 28th are also new moons. A new moon is also the aspect of zero degrees to the Sun, or conjunction. What this indicates is that there a strong tug on the earth when the gravitational pull of the sun and moon are combined. The other smaller peaks are near the full moons when the Moon was at opposition to the Sun in March and April. The full moons represent the point where the gravitational torque is at its greatest where the motion of the moon and the attraction of the sun and moon pull in opposite directions. It takes an enormous amount of energy to change the spin rate of the earth. The new and full moons correspond with a decrease in the spin rate apparently without any associated earthquake activity, however. However, large earthquakes and storms on the sun are also known to cause changes in the earth’s spin rate. We would see this as spike in the spin rate graph. No such spikes are to be seen during the period illustrated. What is observed in the spin rate data is that the periods when there are large earthquakes appears to increase. On April first as the spin rate was nearing a maxima there was an extremely powerful 8.2 earthquake near Iquique, Chile and then a 6.9 aftershock. On the second of April there was a 6.0 in Panama. On April fourth when the spin rate of the earth was at a maxima there was a 6.3 in Iquique, Chile and a 6.0 in Kirakira, Solomon Islands. During most sustained period of increased spin rate from May first to the seventh there was a 6.6 in New Caledonia on the first, a 6.6 and 6.3 south of Fiji and a 6.0 south of Ito, Japan on the fourth. On the fifth of May there was a 6.1 in Thailand. On the sixth there was a 6.3 earthquake on the West Chile Rise in the Pacific Ocean. Finally, on the seventh there was a 6.0 in Papua, New Guinea.
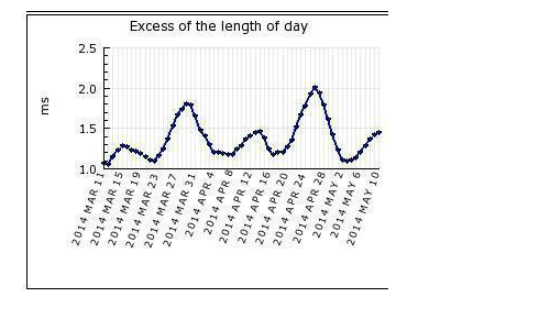
Figure 14. On this chart the higher points represent a longer day. The lowest points on the graph represent the higher spin rates of the earth. The period from April 4th to the 8th shows a high spin rate, during this period Mercury made aspects to Pluto, Uranus, Jupiter and the Sun. Also, the period just before April 20th the graph shows a low spin rate and then a rapid rise in the spin rate after the 20th. The next rise in the spin rate was about May 4th to the 6th when the sun was moving first at 120 degrees to Pluto, then 30 degrees to Uranus and finally at 60 degrees to Jupiter on May 6th. Image courtesy of NASA.
In light of this data the question still remains as to where the earthquakes cause the earth to spin faster, or whether the increase in the spin rate stimulates earthquakes. Regardless of any consideration of causes the increase in spin rate also appears to be associated with a peak in the number of planetary aspects.
Analysis of the Results of the Observations and the Orbital Harmonics of the Solar System
We can begin to see from the observations that in fact the planetary aspects do appear to be associated in time and space with the timing of earthquakes. The evidence is also suggestive of the fact that the planetary aspects affect the spin rate of the earth, which may be a contributing physical mechanism broadly responsible for the changes in the number of earthquakes that are associated with these events, but these effects cannot, through applying standard physics, be attributed to the effects of gravitation, but an argument can be made that the effects are due to electromagnetism.
The beat frequency patterns, the result from subtracting the lower frequency from the higher of two frequencies, observed in the data for the rate of large earthquakes over time are most likely a result of the interacting frequencies of the planets involved. What remains a mystery is where these vibrations are coming from.
The most likely progenitor of the five-day periodicity in the waveforms is the orbital resonances of the participating planets. It appears, if this is the source of the phenomena, that these resonances are amplified at certain geometrical angles which correspond to the angles of the 24th harmonic. The 5 day beat frequency of the rate of large earthquakes observed is very likely due to the heliocentric orbital period of Venus. The period of Venus is 225 days. When 225 is divided by 15 the result is 15 days, almost the exact period of the orbit of the earth divided by 24 and 225 is 15 squared and fifteen degrees is the base of 24th harmonic. It can be observed from this that there would be a harmonic beat frequency of five-days as prime harmonic of the orbital resonance of the Earth and Venus. The 24th harmonic of the earth is about 15 days and the 24th harmonic of the period of Venus is 9.4 days, very close to the beat frequency observed. If we use the beat period formula, F1-F2, then we have 5.6 days, very close to the beat frequency observed in the data. In addition the number of days in a year, 365.25, divided by twenty four is 5.21 days which is even closer to the theoretical beat period. The resolution of the data is too coarse to reveal a beat frequency difference between the observed rate of 5 days and the predicted rate of 5.6 days. As a result it is logical to conclude that the sinusoidal curve observed in the rate of large earthquakes is a result of the 24th harmonic interactions between the orbital resonances of the Earth and Venus. There is nothing obvious in conventional astrophysics which would explain this clearly observed phenomenon, but the wave interactions seem to follow electromagnetic formulae where waves can cancel each other out, or enhance one another. However, now that gravitational waves have been observed we may be seeing a resultant of gravitational harmonic wave vectors that is affecting the interplanetary magnetic field. This may stimulate the flow of electrical currents between the planets and this may play a role in the observed increased rate of seismic activity associated with the planetary aspects.
The orbital periods of each the planets divided by 24 is as follows: Mercury, 3.67 days. Venus 9.4 days, Earth (Sun) 15 days, Mars 28.6 days, very close to the period of the moon, Jupiter 180.5 days, divisible by 15, or just under half a year, Saturn 448 days, 1,278.5 days for Uranus, exactly 3.5 years, Neptune 2,508 days and Pluto 3,773 days, three of these periods is exactly 31 years and for the Moon the orbital period is 27.3 days which makes the 24th harmonic frequency to be 27.3 hours. The beat frequencies would be 11.33, 5.6, 13.6, 165.5, 433, 1263.5, 2493 and 3758 days for each planetary interaction in the same order as the previous list. Future studies may reveal a connection between the geophysical relationship between these frequencies and the rate of earthquakes.
What this shows is the all the planets adhere to a strict harmonic gravitational order. This order is so rigid that even if disturbed by tiny amounts it can result in magnified perturbations of the orbits of the planets leading to possible seismic changes on the any of the rocky planets. The perturbations would cause the planets to vibrate slightly in harmonic rhythm with the timing of the aspects, as these generally mark points of greatest change in the gravitational tresses being applied to the planets by each other.
Another more comprehensive analysis of virtually all the large earthquakes in 2014 was undertaken. This study also included the Great Anchorage earthquakes, The 9.1 in Chile, the Great Tsunami quake in 2004 and the Kamchatka 8.3, which was the largest quake in 2013 for comparison. There were ninety four earthquakes in total, 64 occurred when the closest aspect to the actual angle was applying and 30 after the aspect occurred. This is 234 , or 17.2 billion to one odds against chance. The distribution show that the main peak is between 5 and 10 arcminutes before the aspect actually occurs. (See Figure 15.)
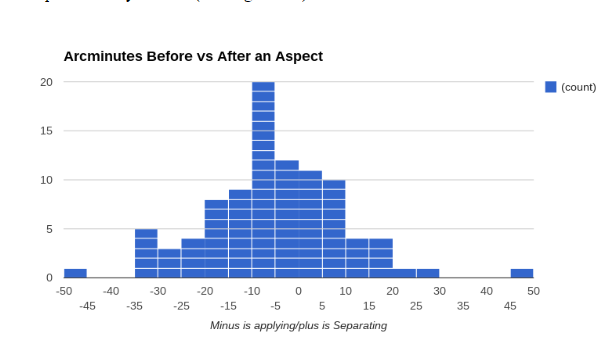
Figure 15. Great Earthquakes of 2014, January to November, 2014.
This graph shows the distribution of the deviation of the closest aspect occurring at the time of a major earthquake in arcminutes. The strong peak in the distribution is between 5 and 10 arc minutes before an aspect is the period during which the greatest number of earthquakes coincided.
Hypotheses of a Possible Physical Mechanism for the Timing of Earthquakes and Planetary Influences
There is an apparent correlation with the spin rate of the earth where when it is at its highest
There appears to be a greater number of planetary aspects, which is also associated with an increase in the number of earthquakes observed. While there are no known physical causes for these types of events to associate the planetary aspects and the physical phenomena that have been observed. However, in the 17th century Johannes Kepler wrote a book called The Harmony of the World which may have the solution to this vexing problem. Kepler’s The Harmony of the World illustrates how musical vibrations can be related to the planets in their orbits causing both harmonies and dissonances between the planets.27 These vibrations are a result of the motions of the planets in their orbits. It appears that the angles of the 24th harmonic stimulate changes in these vibrations possibly causing dissonant vibrations that disrupt the smooth motions of the earth’s tectonic plates. This would result in large earthquakes. How this may occur is still a mystery which that desperately needs to be solved. It is possible that these “musical” vibrations are passed through the interplanetary medium via the interplanetary magnetic field.
An Electromagnetic Theory to Explain the Association between the Positions of the Planets and Earthquakes
A possible explanation of what we are observing is that the triggering of earthquakes is due to electromagnetism. It may be that energy is transferred by the planetary aspects to the earth’s magnetic field and this builds up where there is already a charge where piezoelectric forces that are a result of the pressure on the rocks as the plates grind together. It is well documented that many electrical phenomena are associated with earthquakes.33 In the Journal of Scientific Exploration, Vol. 17, No. 1, pp. 37–71, 2003; there is an excellent report that addresses the problems facing geophysicists trying to understand earthquakes. The paper is titled, Rocks That Crackle and Sparkle and Glow: Strange Pre-Earthquake Phenomena, by Dr. Friedemann T. Freund, a professor in the Department of Physics, San Jose State University, and a senior researcher at NASA Ames Research Center. Dr. Freund writes:
“Many strange phenomena precede large earthquakes. Some of them have been reported for centuries, even millennia. The list is long and diverse: bulging of the Earth’s surface, changing well water levels, ground-hugging fog, low frequency electromagnetic emission, earthquake lights from ridges and mountain tops, magnetic field anomalies up to 0.5% of the Earth’s dipole field, temperature anomalies by several degrees over wide areas as seen in satellite images, changes in the plasma density of the ionosphere, and strange animal behavior. Because it seems nearly impossible to imagine that such diverse phenomena could have a common physical cause, there is great confusion and even greater controversy.”
Freund outlines the basic problem: “Based on the reported laboratory results of electrical measurements, no mechanism seemed to exist that could account for the generation of those large currents in the Earth’s crust, which are needed to explain the strong EM signals and magnetic anomalies that have been documented before some earthquakes. Unfortunately, when a set of observations cannot be explained within the framework of existing knowledge, the tendency is not to believe the observation. Therefore, a general malaise has taken root in the geophysical community when it comes to the many reported non-seismic and non-geodesic pre-earthquake phenomena. There seems to be no bona fide physical process by which electric currents of sufficient magnitude could be generated in crustal rocks.”
A recent discovery that may shed light on the source of where these massive electrical charges are coming from is that NASA has observed that a vast electromagnetic conduit exists between the sun and the earth. Enormous discharges of energy are fed across the space between the earth and the sun along this massive conduit. (48) Billions of watts of electrical energy are fed into the earth’s magnetic field every time an X-point forms high in the earth’s magnetic field. This occurs approximately every eight minutes on average. These discharges vary greatly in the amount of energy produced. When an X-point forms as a result of the intertwining of the earth’s magnetic field lines with the sun’s magnetic field making magnetic ropes. When the ropes pull tight they pinch off at an X-point and then break. This breakage results in an enormous outburst of energy know as a flux transfer event. The intertwining in the suns’ and the earth's’ fields is also intertwined with the interplanetary field and this field also plays a role in flux transfer events. It has also been documented that there are flux transfer events on other planets, planetary moons, in deep interplanetary and possibly even interstellar space. (See Figure 16, 5 images.)
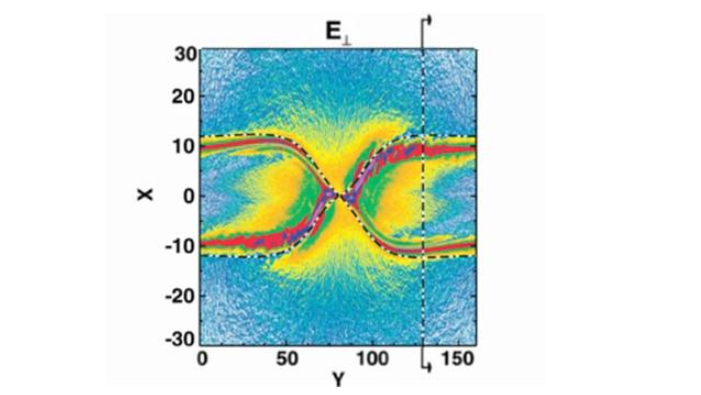
Figure 16, image 1. An example of an X-point from the Polar Spacecraft data circa 1998 provided crucial clues to finding magnetic X-points.47 Image courtesy of NASA.
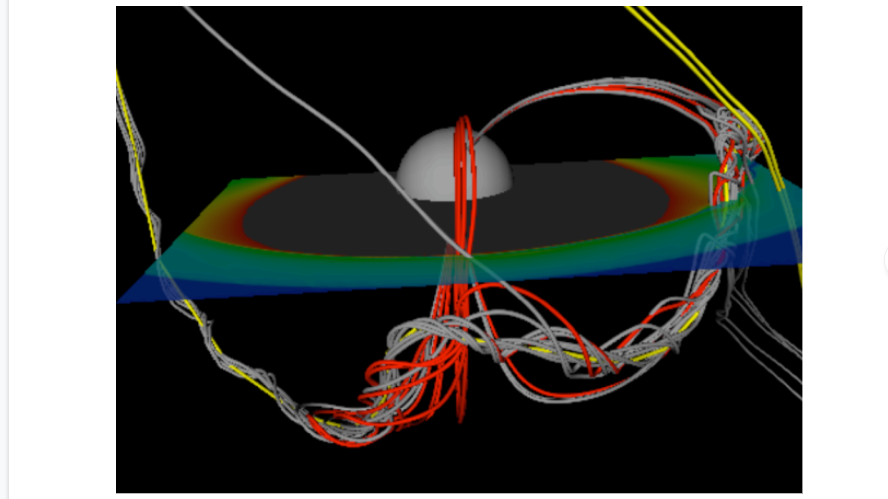
Figure 16 image 2.
A view of the dayside of the earth being influenced by the magnetosphere of the Sun. A magnetic flux rope, or flux transfer event, stretches across the dayside magnetosphere from dawn to dusk. The rope contains magnetospheric magnetic field lines (red), interplanetary magnetic field lines (yellow), and lines that pass from the magnetosphere into interplanetary space (grey). The yellow lines are conduits along which the electromagnetic power is delivered to the earth’s field and this provides the necessary power to produce the flux transfer event. Results are from the University of Michigan's BATS-R-US model with enhanced resolution in the vicinity of the dayside magnetopause. The image is of the earth, in grey, and its magnetic field, grey red lines, being affected (Image courtesy of the University of Michigan.)
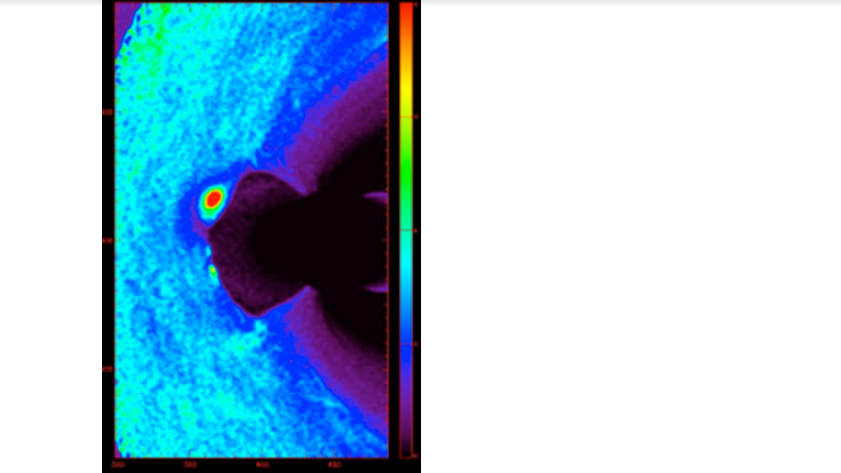
Figure 16 Image 3.
A THEMIS spacecraft image of an actual flux transfer event taking place high in the earth’s magnetosphere. Image courtesy of NASA.
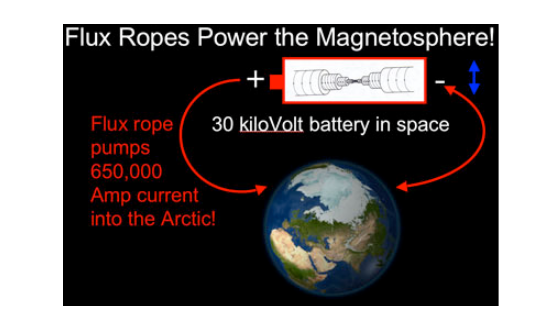
Figure 16 Image 4.
This image courtesy of NASA illustrates the enormous power resulting from flux transfer events. This equals 1,950,000,000 watts of being dumped into the earth’s magnetic field and then into the ground. This is more than enough power to provide the electrical power needed to stimulate an earthquake. Where there is already a high pressure built up along a fault line the electrical field caused by the pressure on the rocks is enhanced by the influx of energy from the sun and planets.
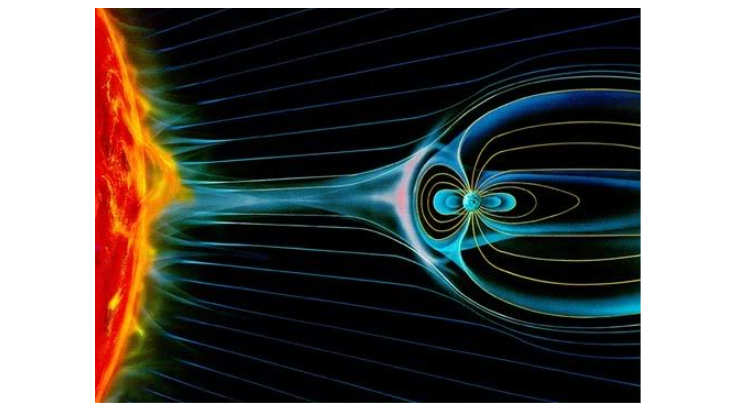
Figure 16, Image 5.
Artist’s impression of the electromagnetic conduit which exists between the earth and the sun. Image courtesy of NASA.
Theoretically, as documented here, there are vast changes that are sometimes associated with earthquakes in the earth's magnetic field. It appears that the buildup in the charge between the plates acts like a sort of “maglev” transport that allows the rock under pressure to slide past one another at a much faster rate than normal. This motion is facilitated by the static electrical and magnetic fields resulting in what we call an earthquake. In this scenario the pressure on the fault line where the earthquake is to occur creates piezoelectric charge due to the pressure on the rocks. As like static electric charges repel one another, the two side of the fault line would also repel one another. The pressure on the rocks also creates a strong magnetic field as a result of the peizomagnetic effect. The peizomagnetic effect is created when pressure is applied to rocks containing diamagnetic minerals such as hematite, which are common in the igneous rocks where most earthquakes occur. The peizomagnetic field then interacts with the geomagnetic field causing magnetic ropes to form between the peizomagnetic field and the earth’s own field. This may eventually cause an X-point to form deep underground and a resultant flux transfer event as a result. The resultant enormous influx of power results in the energy needed to allow an earthquake. This then increases the voltage in the fault line capacitance that then forces the plates apart and ‘maglevs’ them to a new, less electrically and magnetically stressed position. (41,42, 43, 44, 45) This will be discussed in more detail later in this section.
In Electrical Engineering all 3-phase AC motors and generators are always wound to some fraction of the 24th harmonic. The most common is to have 12 separate coils spaced at 30 degrees apart. However to deliver the smoothest power 24 coils spaced at 15 degrees is the ideal configuration making a full wave power transmission. The most common, as it delivers good power at a lower cost that a twenty-four coil motor is the twelve coil motor illustrated in Figure 17.
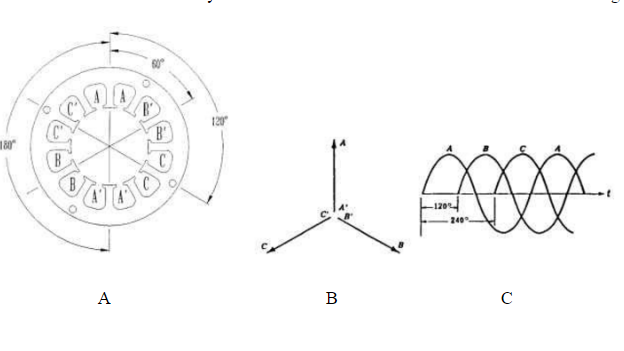
Figure 17. There are many winding line connections that can be used in three-phase drive systems. Figure 17 illustrates the various configurations. The half-wave wye is the simplest three-phase line configuration (Fig. 17.A). It uses three power lines and one return line (four leads). The excitation is shown adjacent to the schematic in Fig. 17A. Only 33 percent (one lead) of the half-wave wye windings are energized at any time in operation. Wye windings are named thus due to the “Y” shape of the schematic. (17.B) The second wye winding, the full-wave wye (Fig. 17.B) has only three leads but 66.7 percent (two leads) of the windings are in operation simultaneously. The excitation scheme is shown to the right of the schematic. (Fig. 17.B) If we double the number of windings we get all three phases, or a full wave.
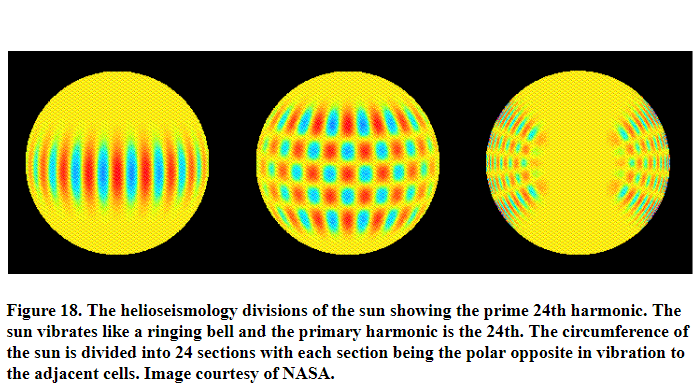
The prime harmonic of the sun's helioseismology, the study of how the Sun vibrates and rings like a bell, is the 24th harmonic. This results in regions of opposite harmonic polarity spaced 15 degrees apart. Each segment on the sun is of the opposite harmonic polarity to the segment on either side. What we may infer from this is that the 24th harmonic is the prime harmonic of the solar system that is generated by the prime vibrations of the sun. In the case of earthquakes the effect is the buildup in charge that electrifies the two opposing sides of the split in the rock along the fault line with the same negative polarity. The opposing charges eventually repels them apart, like two north poles on a magnet, allowing them to slide freely for some distance. This also explains why the spacing of the arcs between the planets by the 24th harmonic is so important. Their prime motivator is in the electrodynamic field of the sun and basic electromagnetic physics. (See Figure 18.)
When rocks are under pressure that is created by the general movement of the tectonic plates, they generate a negative electrical charge. This is known as a piezoelectric effect. This also creates a static field centered on the point of the greatest pressure, where a future earthquake will take place. The data suggests that earthquakes are timed by the pressure building up in the faults creating a piezoelectric field reaching a peak just as the faults slip. The charge builds up to such a great extent that the fault lines in the rock act like a capacitor. The capacitance is a result of the fact that the two plates are electrically separated from each other by the crack in the rock associated with the fault line. If the static charge has built up to such an extent due to piezoelectric induction and then there is a planetary aspect, this then feeds additional electricity into the earth's magnetic field. The peizomagnetic field of the fault line intertwines with the geomagnetic field. The sudden joining of the two magnetic fields creates an electron diffusion region near the fault line as a result of magnetic recombination. The energy from the planetary aspects then funnels the electricity into the ground and electrifies the fault/capacitor even more. The repulsive force generated between the two sides of the fault forces them apart due to the static field. This allows the two sides of the fault to slip, sort of like a maglev effect. When rocks are under pressure they generate a negative electrical charge. This is known as a piezoelectric effect. A magnetic field centered on the point of the greatest pressure is also created by the associated effect called peizomagnetism. (43) From this we may be able to predict where future earthquakes will occur with the proper instrumentation in place.
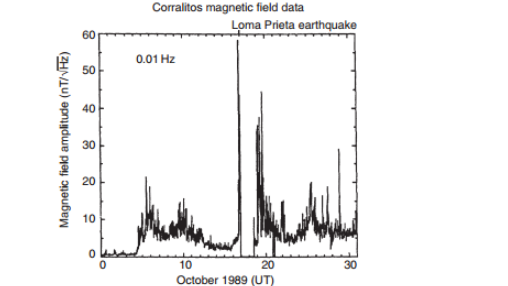
Figure 19. This figure shows the strength of the magnetic field just before and after the Loma Prieta earthquake in 1989. The tick at the top shows the exact moment of the earthquake and we can see that the magnetic field strength reaches a maximum just before the quake. The strength of magnetic field then appears to break and subsequently drops to zero and peaks again then trails off still displaying a strong residual magnetic field. This could very well indicate a flux transfer event. It is also apparent that the field builds up significantly just before the quake occurred. (Image courtesy of the USGS.)
The magnetic field lines created by the fault line and the earth's magnetic field lines intertwine and create what are termed magnetic ropes. These ropes are similar to the ones that are created between the magnetic field of the earth and the magnetic fields of the sun and planets as we saw in Figure 16, image 1. When the tension on these ropes increases due to the increased influx of electrons from the earth's magnetic field the plates begin to move. This put so much tension on the magnetic ropes that they eventually break. When they break they release an enormous discharge of energy. This results in the observed electrical effects such as lights, lightning and other electrical phenomena. This energy results then from a flux transfer event34 between the field generated by the piezoelectric/magnetic generator35 and the earth’s planetary field. This is caused by the breaking of the magnetic ropes at an X-point.
This also may explain why the apparent 5 day periodicity of the earthquakes experiences polarity changes as it may be the result of electromagnetic phenomena and the flow which gets reversed at times. The periods of discharges and charging then become reversed due to an as yet undiscovered switching mechanism. It is well documented that flux transfer events take place at various places in the solar system as well as high above the earth in the magnetic field due to the interactions of the sun’s magnetic field and the earth’s.35 Flux transfer events have also been observed on Mercury, even though it only has a weak magnetic field. (24, 27) As noted above earthquakes can produce anomalies with a strength of up to 0.5% of the total magnetic field of the earth. Putting this in perspective Mercury’s magnetic field is about 1% in strength of the earth’s field. Moreover, earthquakes can produce effects as great as 50% of the Mercury’s total field where flux transfer events have been regularly observed. (See Figure 20.)
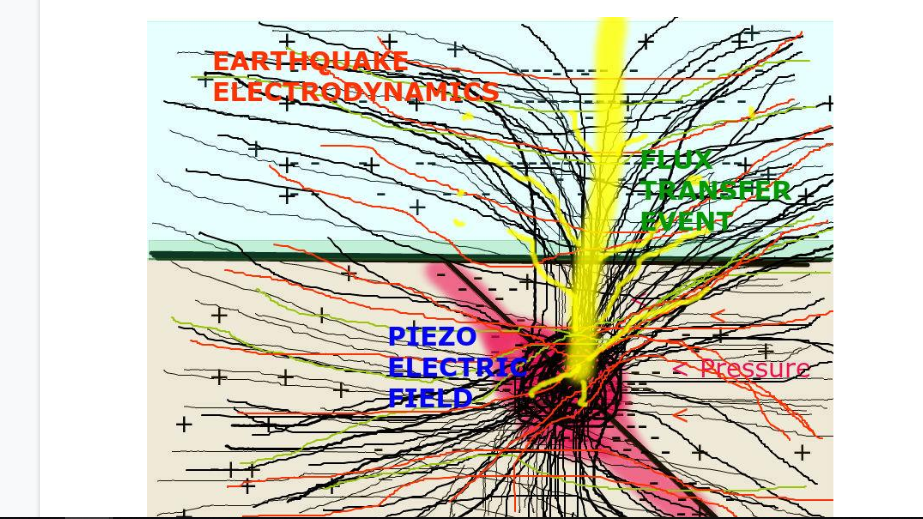
Figure 20.
This is artistic impression of the electrodynamics involved during an earthquake. The black horizontal line is the surface of the earth. The black diagonal line is the fault line and the ‘+’ and ‘-’ signs represent the electrical charges near the event. The fine red and green lines represent the waves originating on the sun and the interplanetary magnetic field carried along by the earth’s own magnetic field. The squiggly black lines represent the field lines of both the earth and the field generated by the piezoelectric effect and the peizomagnetic effect caused by the pressure on the rocks caused the plate on the right moving to the left. Peizomagneitism is produced when diamagnetic minerals are put under pressure and this effect increases exponentially with the increasing pressure. Diamagnetic minerals, such as hematite, are common in igneous rocks such as are found in areas where most earthquakes occur. The pressure builds up creating a strong magnetic field, which then interacts with the earth’s field creating magnetic ropes deep under the earth. When the energy from the planetary aspects is injected into the earth’s field there is such a buildup of charge as a result that the plates are forced apart and slide along the diagonal axis. When this happens there is a flux transfer event, represented by the yellow that results in all the strange observed phenomena associated with earthquakes such as balls of light, lightning, colours hanging the sky and sky glow. (Image courtesy of the author.)
Conclusion
Since antiquity the hypothesis of the astrologers has been that events are more likely to occur before a planetary aspect happens than after the celestial event and that these events included earthquakes. The observations presented here support this assertion. During the course of the main study period it was also discovered that if the number of earthquakes were plotted for five day periods that there emerged a sine wave of earthquake frequency. The fact that Venus’ heliocentric period is 225 days and that 225 is the square of 15 seems very significant. Fifteen degrees is the root of the 24th harmonic. This seems to point to the fact that the prime order of harmonic vibrations is a base 24 system. As has been documented the planets are locked into harmonically spaced orbits. The harmonic orbital ratios that the planets are locked into are all subsets of the 24th harmonic. The earlier earthquake studies undertaken in the 1990’s were subsequently replicated by the observations of the major earthquakes that occurred during the spring of 2014. There were no disagreements between the findings in these two sets of data. The conclusion therefore is that the astrologers were correct in their assertions that the planets in their orbits can be correlated with events on the earth and their timing. The extremely unexpected sinusoidal periodicity of five days in the frequency of large earthquakes is not explained by present astrophysics. This must then be considered to be a newly discovered attribute to the scientifically supported theory of orbital resonances. These resonances and the electrical circuit in the solar system in turn result in massive changes in the earth's magnetic field. With all the diverse phenomena associated with the earthquakes as we have seen: lights in the sky, strange animal behaviour and strong anomalies in the earth's magnetic field associated then it must also be concluded that there is also a strong electromagnetic component to earthquakes as well. It is also well documented from wide ranging sources and from the general historical record that these kinds of events were also studied very closely by the ancient peoples. These ancient astronomers also noted the various diverse phenomena shared apparent association with planetary aspects. From this then it must be concluded that their observations became a fundamental facet of their mystical views of the universe, as discussed in the section, “The Mystical Implications of Planetary Influences on History and Religion.”
As a result of all of these findings we are forced to conclude that the astrologers may have been correct in their assertions that the positions of the planets can be associated with events on the earth. As result the influences of the planets are thereby associated with the conditions under which life on earth must exist. Earthquakes are multifarious events which that can kill countless people and change the environment in profound ways. The application towards a better understanding of earthquakes made possible by the findings presented in this paper may help to ameliorate the destructive effects of earthquakes by allowing a method of predicting where and when they will occur. The detection of earthquakes due to the piezoelectric and peizomagnetic effects is well known and used around the world. Devices are installed in various places to detect earthquakes in this manner.40 If these kinds of detection systems were combined with the ability to predict when the event will occur with respect to association with planetary aspects, then real progress may be possible in the science of earthquake prediction.
_____________________________________________________
Appendix
Table 1
- Sun 75 degrees from Uranus. Mars 180 degrees from Uranus. Sun 135 degrees from Saturn. Sun 105 degrees from Mars. Venus 135 degrees from Mars. Venus 45 degrees from Uranus. Venus 135 degrees from Saturn. Mercury 30 degrees from Jupiter. Moon 0 degrees from the Sun, New Moon. Mars 30 degrees to Saturn.
- Sun 30 degrees from Uranus. Sun 60 degrees from Uranus. Mercury 45 degrees from Uranus. Mercury 45 degrees from Jupiter.
- Mercury 0 degrees from Uranus. Mercury 90 degrees from Jupiter. Mercury 90 degrees from Pluto. Venus 45 degrees from the Sun. Venus 30 degrees from Uranus. Sun 15 degrees from Uranus. Sun 105 degrees from Pluto. Sun 105 degrees Jupiter. Jupiter 90 degrees from Uranus. Jupiter 180 degrees from Pluto.
- Mars 30 degrees from Saturn. Venus 120 degrees from Mars. Venus 90 degrees from Saturn. Sun 90 degrees from Jupiter. Sun 0 degrees from Uranus. Mercury 120 degrees from Saturn. Sun 90 degrees from Pluto.
- Sun 120 degrees from Pluto. Venus 135 degrees from Neptune. Mercury 45 degrees from Mars. Mars 150 degrees from Neptune. Sun 150 from Uranus. Mercury 45 degrees from Saturn.
- Jupiter 75 degrees from Uranus. Mars 150 degrees from Pluto. The Sun 105 degrees from Pluto. Mars 60 degrees from Uranus. Mercury 165 degrees from Saturn. Mercury 135 degrees from Neptune. The Sun 75 degrees from Uranus.
- Jupiter 165 degrees from Neptune. Venus 90 degrees from Neptune. Venus 15 degrees from Jupiter. Mercury 45 degrees from Uranus. Mercury 135 Degrees from Pluto. Venus 150 degrees from Saturn. The Sun 45 degrees from Uranus. The Sun 135 degrees from Pluto. Mars 75 degrees from Neptune.
- Saturn 150 degrees Uranus. Mercury 75 degrees from Jupiter. The Sun 105 degrees from Saturn. Mars 165 degrees from Pluto. The Sun 165 degrees from Pluto. Mercury 30 degrees from Neptune. Sun conjunct Mars.
- Mercury 15 degrees from Neptune. Venus 15 degrees from Neptune. The Sun 30 degrees from Pluto. Venus 75 degrees from Saturn. The Sun 90 degrees from Saturn. Mercury 45 degrees from Uranus. Mercury 165 degrees from Jupiter, Venus 30 degrees from Mars. Mercury 45 degrees from Pluto. Mercury 165 degrees from Saturn. Venus 30 degrees from Neptune. Mars 0 degrees from Neptune. The Sun 15 degrees from Neptune. Venus 60 degrees from Uranus. Mercury 0 degrees from Neptune. Venus 120 degrees from Jupiter. The Sun 15 degrees from Mercury. Mercury 15 degrees from Mars. Mercury 30 degrees from Uranus. The Sun 15 degrees from Mars. The 45 degrees from Uranus. Mercury 90 degrees from Jupiter. Mars 30 degrees from Uranus. The Sun 165 degrees from Jupiter. Mars 90 degrees from Jupiter. Venus 30 degrees from Pluto. Venus 90 degrees from Saturn. Mercury 60 degrees from Pluto.
Table 2 . This table shows the actual number
of earthquakes for each 5 day period
between January 8th and May 8th, 2014. UTC.
Jan. 8 0 Feb. 17 0 Mar. 29 2 May 8 7
Jan. 13 1 Feb. 22 1 Apr. 3 6
Jan. 18 0 Feb. 27 0 Apr. 8 2
Jan. 23 2 Mar. 4 3 Apr. 13 9
Jan. 28. 2 Mar. 9 1 Apr. 18 4
Feb. 2 2 Mar. 14 4 Apr. 23 3
Feb. 7 2 Mar. 19 4 Apr. 28 2
Feb. 12 2 Mar. 24 3 May 3 1
Table 3. The geocentric aspects between the earth and Venus between November, 2012 and November 2014 that were associated with a polarity change in the five day earthquake cycle. Venus never gets closer to the than 135 degrees to the earth due to its proximity with the sun.
Venus 150 degrees to the earth 11/19/2012
Venus 165 degrees to the earth 12/16/2012
Venus 180 degrees to the earth 11/22/2013
Venus 150 degrees to the earth 7/22/2013
Venus 135 degrees to the earth 10/5/2013
Venus 135 degrees to the earth 11/15/2013
Venus 135 degrees to the earth 4/15/2014
Venus 150 degrees to the earth 7/1/2014
Venus 150 degrees to the earth 8/29/2014
Venus 180 degrees to the earth 10/25/2014
Appendix 2.
Formula and analysis for Pearson Correlation for 5 day earthquake periodicity.
Pearson correlation.
Notes
- Howard Cornell, Encyclopedia of Medical Astrology pg. 192, (New York, Samuel Weiser. 1972)
- Anthony Louis, “ Astrology & Tarot Blog,” https://tonylouis.wordpress.com/2013/05/23/can-earthquakes-be-predicted-with-astrology/ (November 15, 2014)
- Robert Curry, “Astrology Notes on Earthquakes- Increased risk with Saturn and Uranus in Opposition,” http://www.astrology.co.uk/news/quakes.htm (November 15, 2014)
- http://www.esotericapublications.com/article-507.html (November 15, 2014)
- Hassan Jaffer, “Astrology of Earthquakes,” http://www.astrocycles.net/astrology-of-earthquakes/ (November 15, 2014)
- J Gribben, S. Plagemann, The Jupiter Effect The Planet As Triggers of Devastating Earthquakes ( New York, Walker & Co., September 1974) pg. 192
- http://cura.free.fr/xv/13brianj.html (November, 2014)
- Johnston, Planetary Aspects and Terrestrial Earthquakes, The International Astrologer, (Los Angeles, 2001)
- Howard Cornell, Encyclopedia of Medical Astrology pg. 192, (New York, Samuel Weiser. 1972)
- Ibid. pg. 35.
- Ibid. pg. 524
- Ibid. pg. 595
- Ibid pg. 624
- B. Johnston, “Astrological Reasearch,” http://brianjohnston200.wix.com/skepticsand-science#!astrological-research/c1wy6http://brianjohnston200.wix.com/skepticsand-science#!astrological-research/c1wy6 and http://brianjohnston200.wix.com/skepticsand-science#!astrological-research-pg-2/c1y1h (November 17, 2014)
- USGS, Search Earthquakes Catalog,” http://earthquake.usgs.gov/earthquakes/search/ (November 15, 2014)
- Howard Cornell, “Encyclopedia of Medical Astrology,” pg. 192, (New York, Samuel Weiser. 1972) pg. 192
- Johnston, “Planetary Aspects and Terrestrial Earthquakes,” The International Astrologer, (Los Angeles, 2001)
- Ophira and Tali Edut, “April’s Angst: What The Grand Cardinal Cross Means for You.” http://astrostyle.com/april-grand-cross/ (March, 2014)
- Marina, Dark Star Astrology, “Grand Cardinal Cross,” http://darkstarastrology.com/grand-cross-2014/ (March, 2014)
- Simone M. Mattews, “April 2014- Cardinal Grand Cross- Astrology,” http://www.universallifetools.com/2014/03/cardinal-grand-cross-april-2014/ (March, 2014)
- Earthquake Track, ”Today’s Earthquakes,” http://earthquaketrack.com/recent (May 15, 2014)
- B. Johnston, “Research,” http://thecanadianinstituteforappliedastronomy.yolasite.com/research.php November 15, 2014
- B. Johnston, “Research,” http://thecanadianinstituteforappliedastronomy.yolasite.com/research.php
- Earthquake Track, “Biggest,” http://earthquaketrack.com/biggest (November, 15, 2014)
- Convert a lot, “Earthquake Power Calculator,” http://www.convertalot.com/earthquake_power__calculator.html (November 15, 2014)
- Stephen Hawking, “On The Shoulders of Giants, The Harmony of the World, Book IV” (Running Press, Philadelphia, 2003)
- Douglas Meyer, “Wolfram von Eschenbach’s Secret of the Holy Grai,” http://www.rosecroixjournal.org/issues/2014/articles/vol10_60_71_meyer.pdf (San Jose, 2014)
- Ibid.
- Ibid.
- Ibid.
- B. Johnston, “Great Earthquakes of 2014” http://thecanadianinstituteforappliedastronomy.yolasite.com/great-earthquakes-of-2014.php
- Joseph Stromberg, “Wh do Lights Sometimes Appear in the Sky During an Earthquake?” http://www.smithsonianmag.com/science-nature/why-do-lights-sometimes-appear-in-the-sky-during-an-earthquake-180948077/?no-istgkg (June 10, 2015)
- NASA, “Magnetic Portals Connect the Earth to the Sun,” http://science.nasa.gov/science-news/science-at-nasa/2008/30oct_ftes/
- Lira and Jorge A. “Electric Displacement by Earthquakes Antonio,” Heraud Pontificia Universidad Católica del Perú Peru http://www.intechopen.com/books/seismic-waves-research-and-analysis/electric-displacement-by-earthquakes
- The Physics arXiv Blog, “Voyager 1 May Be Caught Inside an Interstellar Flux Transfer Event,” https://medium.com/the-physics-arxiv-blog/voyager-1-may-be-caught-inside-an-interstellar-flux-transfer-event-6911d42443b (June 10, 2015)
- Slavin, J. A., et al. (2012), “MESSENGER observations of a flux-transfer-event shower at Mercury,” J. Geophys. Res., 117, A00M06, doi:10.1029/2012JA017926,
http://phys.org/news/2012-11-high-frequency-flux-events-mercury.html (June 10, 2015) - J. P. Eastwood,1 T. D. Phan,2 R. C. Fear,3 D. G. Sibeck,4 V. Angelopoulos,5 M. Øieroset,2 and M. A. Shay6 Received 13 M, “Survival of flux transfer event (FTE) flux ropes far along the tail magnetopause.” , JOURNAL OF GEOPHYSICAL RESEARCH, VOL. 117, A08222, doi:10.1029/2012JA017722, 2012
- H. Hasegawa, J. Wang, M. W. Dunlop, Z. Y. Pu, Q.-H. Zhang, B. Lavraud, M. G. G. T. Taylor, O. D. Constantinescu, J. Berchem, V. Angelopoulos, J. P. McFadden, H. U. Frey, E. V. Panov, M. Volwerk, Y. V. Bogdanova. “Evidence for a flux transfer event generated by multiple X-line reconnection at the magnetopause,” Geophysical Letters, 20 August 2010
- M.J.S Johnston, Electromagnetic Fields Generated by Earthquakes, US Geological Survey, Menlo Park, Cal.
- Sid Perkins, “Could Pulses in Earth's Magnetic Field Forecast Earthquakes?” http://www.sciencemag.org/news/2014/06/could-pulses-earths-magnetic-field-forecast-earthquakes (captured May 18th, 2016.)
- David Appell , “Electromagnetic signals ‘can predict earthquakes’,” https://www.newscientist.com/article/dn2395-electromagnetic-signals-can-predict-earthquakes/ (captured May 18, 2016)
- M.J.S. Johnston, Electromagnetic Fields Generated By Earthquakes,” https://profile.usgs.gov/myscience/upload_folder/ci2010Nov2222285142871139.pdf (captured May 18, 2016)
- USGS, “Geomagnetism and Earthquake Prediction,” http://geomag.usgs.gov/research/geomagnetism-earthquakes.php (captured May 18, 2016)
- NASA, “Anticipating Earthquakes,” http://science.nasa.gov/science-news/science-at-nasa/2003/11aug_earthquakes/ (captured May 18, 2016)
- EKSPERIMENTAL EVIDENCE OF ELECTRIFICATION PROCESSES AT THE 2009 L’AQUILA EARTHQUAKE MAINSHOCK P. Nenovski University Center of Space Research and Technology, Sofia University, Sofia, Bulga, 2010
- NASA, “Hidden Portals in Earth’s Magnetic Field,” http://www.nasa.gov/mission_pages/sunearth/news/mag-portals.html captured May 2016
- D. Toney Philips, “Hidden Portal Connect the Earth to the Sun,” http://science.nasa.gov/science-news/science-at-nasa/2008/30oct_ftes/ captured May 15, 2016
References
Howard Cornell, Encyclopedia of Medical Astrology pg. 192, (New York, Samuel Weiser. 1972)
Alison Chester-Lambert , “Predicting Earthquakes, “ http://www.midlandsschoolofastrology.co.uk/predicting_earthquakes_-_a_little_science.html (November 15, 2014.)
Anthony Louis, “ Astrology & Tarot Blog,” https://tonylouis.wordpress.com/2013/05/23/can-earthquakes-be-predicted-with-astrology/ (November 15, 2014)
Robert Curry, “Astrology Notes on Earthquakes- Increased risk with Saturn and Uranus in Opposition,” http://www.astrology.co.uk/news/quakes.htm http://www.astrology.co.uk/news/quakes.htm (November 15, 2014)
http://www.esotericapublications.com/article-507.html (November 15, 2014)
Hassan Jaffer, “Astrology of Earthquakes,” http://www.astrocycles.net/astrology-of-earthquakes/ (November 15, 2014)
J Gribben, S. Plagemann, “The Jupiter Effect The Planet As Triggers of Devastating Earthquakes,” New York, Walker & Co., September 1974, pg. 192
Johnston, “Planetary Aspects and Terrestrial Earthquakes,” http://cura.free.fr/xv/13brianj.html. November, 2014
Johnston, “Planetary Aspects and Terrestrial Earthquakes,” The International Astrologer,” Los Angeles, 20016
Johnston, “Astrological Research,” http://brianjohnston200.wix.com/skepticsand-science#!astrological-research/c1wy6http://brianjohnston200.wix.com/skepticsand-science#!astrological-research/c1wy6 and http://brianjohnston200.wix.com/skepticsand-science#!astrological-research-pg-2/c1y1h, November 17, 2014
Johnston, “Planetary Aspects and Terrestrial Earthquakes,” The International Astrologer, (Los Angeles, 2001
Ophira and Tali Edut, “April’s Angst: What The Grand Cardinal Cross Means for You.” http://astrostyle.com/april-grand-cross/, March, 2014
Marina, Dark Star Astrology, “Grand Cardinal Cross,” http://darkstarastrology.com/grand-cross-2014/. March, 2014
Simone M. Mattews, “April 2014- Cardinal Grand Cross- Astrology,” http://www.universallifetools.com/2014/03/cardinal-grand-cross-april-2014/, March, 2014
Earthquake Track, ”Today’s Earthquakes,” http://earthquaketrack.com/recent, May 15, 2014
- Johnston, “Research,” http://thecanadianinstituteforappliedastronomy.yolasite.com/research.php November 15, 2014
Earthquake Track, “Biggest,” http://earthquaketrack.com/biggest, November, 15, 2014
Convert a lot, “Earthquake Power Calculator,” http://www.convertalot.com/earthquake_power__calculator.html, November 15, 2014
Stephen Hawking, “On The Shoulders of Giants, The Harmony of the World, Book IV,” Running Press, Philadelphia, 2003
Douglas Meyer, “Wolfram von Eschenbach’s Secret of the Holy Grai,” http://www.rosecroixjournal.org/issues/2014/articles/vol10_60_71_meyer.pdf, San Jose, 2014
- Johnston, “Great Earthquakes of 2014” http://thecanadianinstituteforappliedastronomy.yolasite.com/great-earthquakes-of-2014.php
Joseph Stromberg, “Why do Lights Sometimes Appear in the Sky During an Earthquake?” http://www.smithsonianmag.com/science-nature/why-do-lights-sometimes-appear-in-the-sky-during-an-earthquake-180948077/?no-istgkg, June 10, 2015
NASA, “Magnetic Portals Connect the Earth to the Sun,” http://science.nasa.gov/science-news/science-at-nasa/2008/30oct_ftes/
Lira and Jorge A. “Electric Displacement by Earthquakes Antonio,” Heraud Pontificia Universidad Católica del Perú Peru http://www.intechopen.com/books/seismic-waves-research-and-analysis/electric-displacement-by-earthquakes
The Physics arXiv Blog, “Voyager 1 May Be Caught Inside an Interstellar Flux Transfer Event,” https://medium.com/the-physics-arxiv-blog/voyager-1-may-be-caught-inside-an-interstellar-flux-transfer-event-6911d42443b, June 10, 2015
Slavin, J. A., et al. (2012), “MESSENGER observations of a flux-transfer-event shower at Mercury,” J. Geophys. Res., 117, A00M06, doi:10.1029/2012JA017926,
http://phys.org/news/2012-11-high-frequency-flux-events-mercury.html, June 10, 2015
- P. Eastwood,1 T. D. Phan,2 R. C. Fear,3 D. G. Sibeck,4 V. Angelopoulos,5 M. Øieroset,2 and M. A. Shay6 Received 13 M, “Survival of flux transfer event (FTE) flux ropes far along the tail magnetopause.” , JOURNAL OF GEOPHYSICAL RESEARCH, VOL. 117, A08222, doi:10.1029/2012JA017722, 2012
- Hasegawa, J. Wang, M. W. Dunlop, Z. Y. Pu, Q.-H. Zhang, B. Lavraud, M. G. G. T. Taylor, O. D. Constantinescu, J. Berchem, V. Angelopoulos, J. P. McFadden, H. U. Frey, E. V. Panov, M. Volwerk, Y. V. Bogdanova. “Evidence for a flux transfer event generated by multiple X-line reconnection at the magnetopause,” Geophysical Letters, 20 August 2010
M.J.S Johnston, Electromagnetic Fields Generated by Earthquakes, US Geological Survey, Menlo Park, Cal.
Sid Perkins, “Could Pulses in Earth's Magnetic Field Forecast Earthquakes?” http://www.sciencemag.org/news/2014/06/could-pulses-earths-magnetic-field-forecast-earthquakes. captured May 18th, 2016.
David Appell , “Electromagnetic signals ‘can predict earthquakes’,” https://www.newscientist.com/article/dn2395-electromagnetic-signals-can-predict-earthquakes/, captured May 18, 2016
M.J.S. Johnston, Electromagnetic Fields Generated By Earthquakes,” https://profile.usgs.gov/myscience/upload_folder/ci2010Nov2222285142871139.pdf, captured May 18, 2016
USGS, “Geomagnetism and Earthquake Prediction,” http://geomag.usgs.gov/research/geomagnetism-earthquakes.php, captured May 18, 2016
NASA, “Anticipating Earthquakes,” http://science.nasa.gov/science-news/science-at-nasa/2003/11aug_earthquakes/, captured May 18, 2016
EKSPERIMENTAL EVIDENCE OF ELECTRIFICATION PROCESSES AT THE 2009 L’AQUILA EARTHQUAKE MAINSHOCK P. Nenovski University Center of Space Research and Technology, Sofia University, Sofia, Bulga, 2010
NASA, “Hidden Portals in Earth’s Magnetic Field,” http://www.nasa.gov/mission_pages/sunearth/news/mag-portals.html captured May 2016
- Toney Philips, “Hidden Portal Connect the Earth to the Sun,” http://science.nasa.gov/science-news/science-at-nasa/2008/30oct_ftes/ captured May 15, 2016
Adendum
For the public record I recorded this on Google drive There will be <=three earthquakes <6 between September 17 and 27th on 16 September, at 23:46 we have now had three. This was based on Mexican Hat calculations with reference to the previous opposition of Jupiter and Uranus.
The circumstances of the 7.1 earthquake in Mexico were that the closest aspect was Uranus semisquare Neptune at 13 arcminutes applying. The moon was applying at 33 arcminutes to the square of Saturn. The was applying at 18 arcminutes to the 165 degree angle with Neptune. The sun was also applying at 40 arcminutes to the 150 degree angle (inconjunct) to Uranus. Mars was applying to the semisquare with Jupiter a 1 degree 29 arcminutes.
There has been a 6.1 earthquake in the southern Ocean south of New Zealand. The circumstances of the quake were that Mercury was applying at 9 arminutes to the opposition of Neptune and applying at 22 arcminutes to the sesquiquadrate of Uranus. Mercury was exactly 14 degrees 0 minutes to the 13 degree aspect with the sun. The Sun was applying at 22 arcminutes to the inconjunct with Uranus and at 9 arcminutes to the 165 degree angle with Neptune. The was applying at 21 arcminutes to the semisextile with Jupiter and was just under two degrees from conjunction with the Sun: the New Moon.
There has been a 6.1 earthquake off the coast of Japan. The closest aspect was Uranus semisquare Neptune at 10 arcminutes applying. Mercury was about a degree past the opposition of Neptune. Venus was applying sesquiquadrate to Pluto and the sun was 20 arminutes past the inconjunct with Uranus.
There has been a 6.5 earthquake in Vanuatu. The closest aspect again was Uranus applying to the semisquare with Neptune at 10 arcminutes. Mars was just over a degree from the semisquare with Jupiter. applying. Mercury was also just past the 15 degree angle for both the quakes today.
This was recorded for public record on September 22, 2017 at 15:30 EST.
There should be >=2 earthquakes >6 between the 22nd and 27th of September
The results were that there was a 6.1 in Mexico on September 23rd at near where the 8.1 took place earlier in the month. The nearest aspect was Mars applying at 135 degrees 22 arcminutes to Pluto
The second earthquake occurred in Vanuatu on September 26th at 12:20 AM est. The closest aspect was the moon applying square to Neptune at 90 degrees 8 arcminutes.
All the aspects were applying as predicted in the paper
© Copyright The Science of Astrology